
Which Party Has Done More to Increase Federal Debt?
Ron Johnson has pushed hard on this issue. What has been the result?
Ron Johnson. Photo by Gage Skidmore from Peoria, AZ, United States of America / Attribution-ShareAlike 2.0 Generic (CC BY-SA 2.0)
Following his election to the US Senate in 2010, Ron Johnson became widely known for his obsession with the growing federal deficit. As a May 2018 article by Bruce Murphy on Johnson noted:
Johnson became Washington’s premier deficit scold, with endless charts on America’s debt and a Power-Point presentation he foisted on members of both parties.
Although links to his charts and presentations have since disappeared, here is an example:
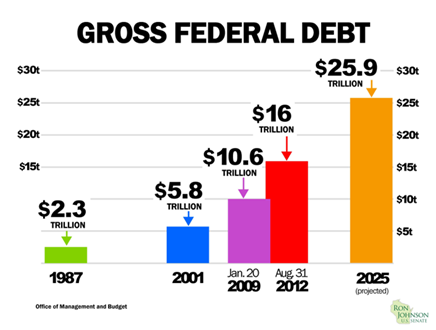
Gross Federal Debt
In December 2017 Johnson voted for the tax cut plan pushed by Republicans and President Donald Trump. Johnson claimed that the bill represented “pro-growth tax reform.” Did the law result in economic growth? The next chart plots the change in US and Wisconsin jobs between 2006 and April of this year. Trump inherited an economy that had largely recovered from the Great Recession of the previous decade. It is hard to discern any growth effect from the tax cut.
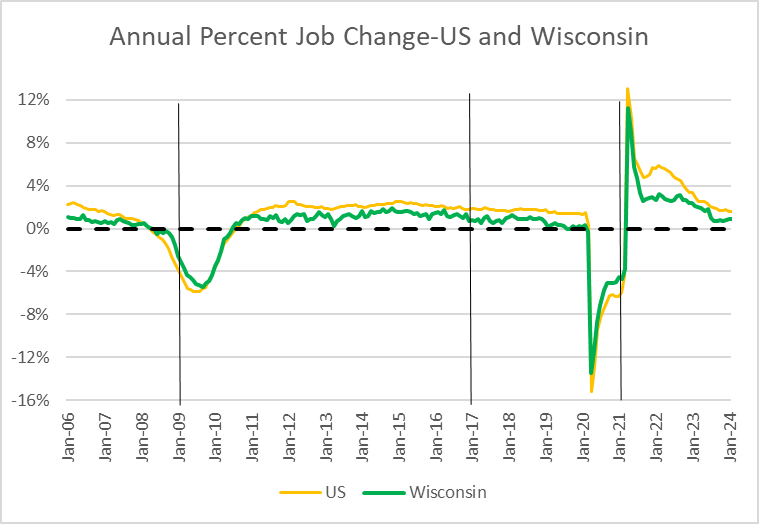
Annual Percent Job Change-US and Wisconsin
It is no secret that federal government debt has increased substantially in recent decades. The chart below shows the ratio of total federal debt to the gross domestic product between 1966 and 2023. (1966 is when the data series on the St. Louis Federal Reserve Bank’s FRED database starts.)
The ratio of debt to GDP is a better measure than the amount of the debt in nominal dollars, since it takes out the effect of inflation and population and better measures the magnitude of the burden that the debt places on the US economy.
As can be seen from the graph, during that period the debt to GDP ratio increased from about 40% to 120%. But this growth did not happen all at once. Two events, indicated by arrows, were major contributors to this growth.
The first, starting in late 2007, was the Great Recession—the worst economic crisis since the Great Depression in the 1930s. Recessions are particularly damaging to the federal deficit because they decrease the inflows as tax collections go down and increase the outflows as economic needs grow.
The other event was the Covid Pandemic, which resulted in substantially reduced economic activity in an attempt to reduce the spread of the virus.
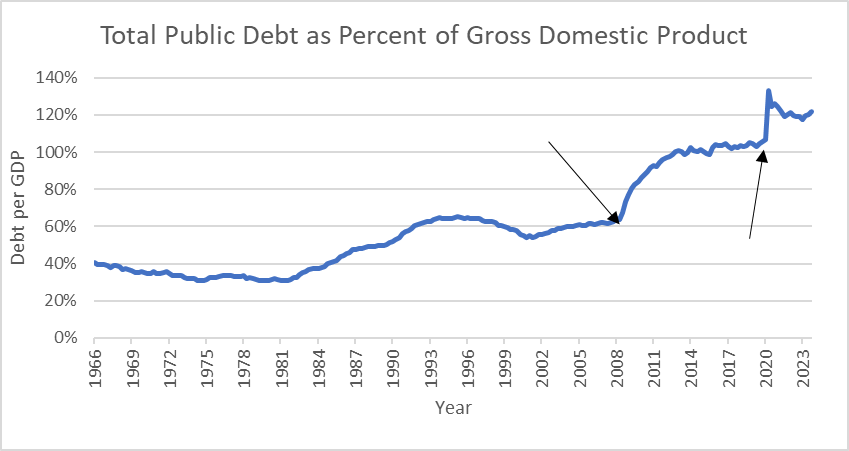
Total Public Debt as Percent of Gross Domestic Product
Other increases and decreases in debt reflect policy decisions under various presidents. The next graph shows this history since 1966. Columns above the zero axis indicate an increase in federal debt; those below the zero axis indicate a decrease. The color indicates the party of the president at the time.
- Between 1966 and 1980 the ratio declined somewhat as GDP grew faster than the debt.
- The period between 1981 and the mid 90’s saw the ratio of debt to GDP double, increasing to 60%. The Reagan administration, and the early Bush administration, increased defense spending while cutting taxes. The effect was to cut inflows while boosting outflows. This was the period in which the theory that tax cuts paid for themselves by stimulating economic activity was believed by those on the right. Today, that theory is widely discredited by reputable economists.
- In 1990, President George H.W. Bush responded to the growing deficit by negotiating with Democrats to pass a bill raising taxes and cutting some programs. While this led to Bush’s loss to Bill Clinton, it helped lead to the subsequent boom under Clinton. Three weeks after taking office in 1993, Clinton made his first address to the nation, announcing his plan to raise taxes to close a budget deficit. Much of the right reacted with horror. The editorial page of the Wall Street Journal accused him of trying to tank the economy. Instead, this led to an economic boom and government surpluses, the only surpluses since 1969.
- When George W. Bush took office in 2001, he became convinced that the boom years of the 90s were coming to an end. To counteract this he convinced Congress to pass a law that reduced taxes. As a result, the deficit moved back up to 60% and the economy remained sluggish.
There is a partisan pattern to this history as laid out in the graph below: red Republican columns point up (except for Nixon), showing an increase in debt, and blue Democratic columns point down (except for Obama who was faced by the Great Recession), showing a decrease in debt. The most likely explanation for this pattern is that at least since the Reagan administration Republicans have been in thrall to the theory that cutting taxes is the key to prosperity. In its extreme form, the theory says that tax cuts pay for themselves by creating more economic activity.
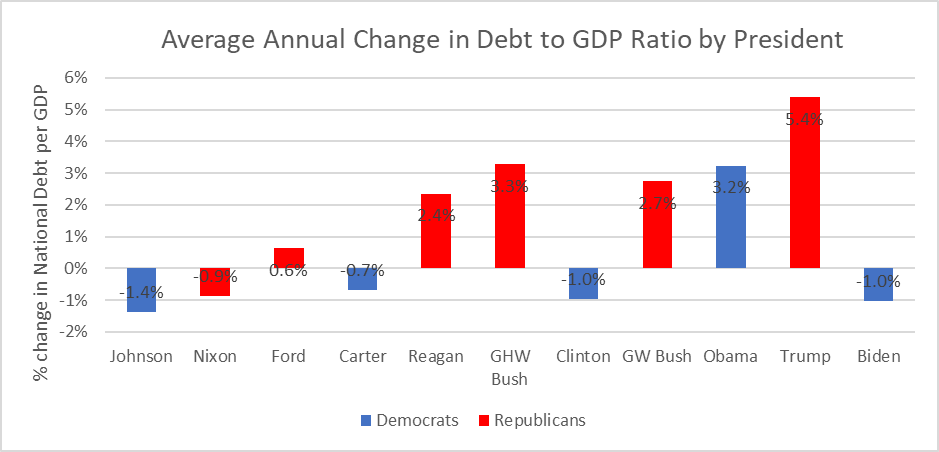
Average Annual Change in Debt to GDP Ratio by President
As the next graph shows the same partisan pattern holds if we break time into years, rather than presidential terms. Using years allows us to view the first three years of the Trump administration, during which Wisconsin’s Ron Johnson joined fellow Republicans to vote for the tax cut, as distinct from the final year, during which Covid struck.
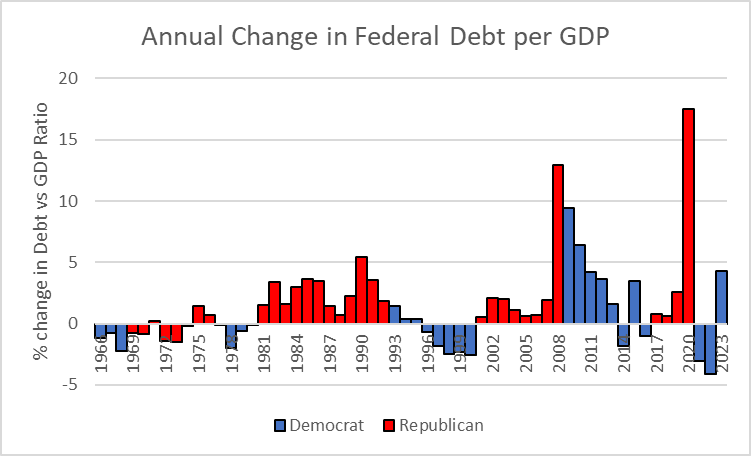
Annual Change in Federal Debt per GDP
One criticism of attempts to associate economic data with presidents is that the influence of the former president may extend into the term of the successor. To test the likelihood of this, the next graph shows the effect of delaying the transition for an extra year. The pattern still holds, with Republican presidents adding most of the increase in federal debt.
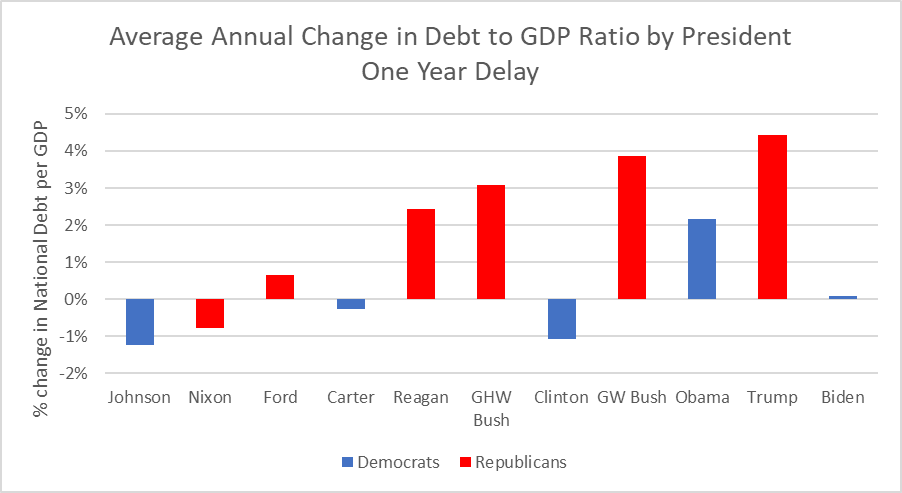
Average Annual Change in Debt to GDP Ratio by President One Year Delay
There are two ways to lower federal debt. One is to increase revenues, through such measures as making taxes more progressive by raising the rates for higher incomes or by eliminating the cap on the Social Security tax. Unfortunately, these measures run counter to the widespread belief on the right that wealthy people are overtaxed.
Increasing funding for the IRS is another strategy. An estimate by the nonpartisan Congressional Budget Office estimates that the Administration’s proposal to increase funding for the IRS by $80 billion over 2022–2031 would increase revenues by approximately $200 billion over those 10 years. Legislation passed by the Republican House would have banned that proposal. Apparently, wealthy people should have the right to underreport their income.
Having rejected revenue increases, Republicans have turned to cutting spending. About 30% of federal expenditures are discretionary, with defense taking a bit less than half of this. This means that each year Congress can decide how much to spend on things like research, environmental regulation, roads and national parks.
At the end of World War II, the US deficit peaked at 106% of GDP, very similar to the present amount, but quickly the deficit quickly went down. However, a recent study concluded that today’s deficit is unlikely to repeat that trick:
The upshot is that reducing the debt/GDP ratio substantially will probably require primary budget surpluses. Yet surpluses also appear unlikely: Under current policy, the Congressional Budget Office predicts large primary deficits over the next three decades. … these deficits are likely to push the debt/GDP ratio to higher and higher levels.
That is particularly true if “deficit scolds” like Senator Johnson vote to increase the deficit by reducing taxes on wealthy people.
If you think stories like this are important, become a member of Urban Milwaukee and help support real, independent journalism. Plus you get some cool added benefits.
Data Wonk
-
How Global Climate Change Affects Milwaukee
 Mar 11th, 2026 by Bruce Thompson
-
Will Lawsuits Demanding New Congressional Maps Succeed?
 Mar 4th, 2026 by Bruce Thompson
-
What the 2025 Elections Data Tells Us
 Feb 11th, 2026 by Bruce Thompson


I’m thinking it would not have mattered who was President during the Great Recession years – I’m pretty sure those numbers would have been pretty similar regardless of who was in the Oval Office. So, setting aside the Great Recession years, it seems pretty clear that the greatest and most consistent annual increases in federal debt to GDP ratio occurred under the oh-so-careful watch of Republicans. So let’s keep pushing for lower taxes on the rich, lower (or no) corporate taxes, and let’s be sure to add in more than a pinch of deregulation that would benefit those that already profit billions annually.
I wonder if that do nothing RoJo will borrow any of these charts for upcoming powerpoint presentations.
One additional economic point needs to be taken into consideration. It’s the “utility value of the dollar.” The “marginal utility value” shows that every additional dollar is more valuable to people who make less money. People who make less money are more likely to spend their next dollar, because they need to buy and pay for living expenses. Since the GDP is measured by the sale of goods and services, not savings and investments, the GDP will grow faster if more money is put into the hands of those who have less and need it the most. Therefore, the philosophy behind cutting taxes for the wealthy and corporations in order to spur the economy and GDP, doesn’t work as much as putting more money into the hands of those who need it the most. Cutting taxes, as has been the hallmark of Republican presidents since Reagan, reduces the federal income and grows the national debt, without commensurate growth in the GDP.
Obama could not get Economic Bills passed. Biden can not get any real economic bills passed.