How Partisan Is Wisconsin’s Congressional Delegation?
DW-NOMINATE shows our members are typically more partisan than the median.

Western front of the U.S. Capitol.
In the early 1980s, two political scientists, Keith T. Poole and Howard Rosenthal, developed a mathematical model to measure political preferences, which they applied to the US Congress. It was based on voting behavior. Essentially, if two legislators usually voted the same way, the model would place them close together; those who generally voted differently would be place far away from each other.
The current version of the model is called DW-NOMINATE (an acronym for dynamic, weighted Nominal Three-Step Estimation). It reduces roll-call voting to a pair of scales. For example, members of the US Congress are placed on a two-dimensional map, with politicians who are ideologically similar (i.e. who often vote the same) being close together.The dimension that has received the most attention corresponds to the familiar left–right political spectrum. The second dimension reflects issues that cut across liberal–conservative lines, such as slavery, currency, nativism, civil rights, and lifestyle issues during periods of American history. More recent examples might be abortion and of gun rights in the United States, reflecting the presence of anti-abortion Democrats or gun-control Republicans.
Wikipedia offers more information on DW-NOMINATE. The website for DW-NOMINATE is voteview.com.
The next graph shows the scores for Senators and House Representatives in the current (118th) Congress. The small blue dots represent the scores for the Democratic members of Congress. The red dots represent the Republican legislators. The scales range from -1 (most liberal) to +1 (most conservative).
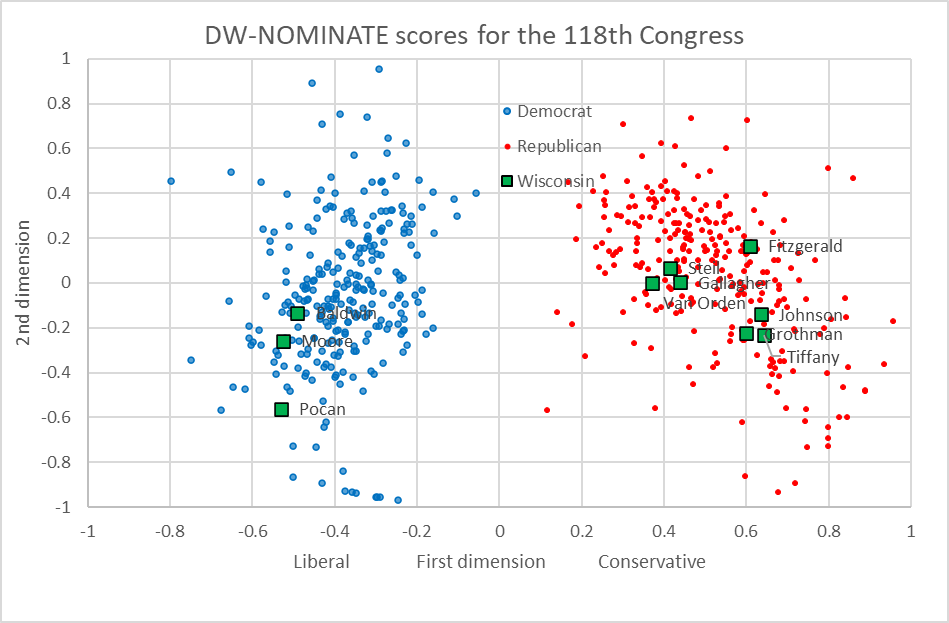
DW-NOMINATE scores for the 118th Congress.
Note that there is no overlap between the two groups. The most liberal Republican is now more conservative than the most conservative Democrat.
The 10 green squares in the graph represent the 10 members of the Wisconsin congressional delegations. Sen. Tammy Baldwin and Reps. Mark Pocan and Gwen Moore, the Democratic members, are shown on the left. All three are close together and further left than the median Democrat on their liberal-conservative scores (an average of -0.516, compared to -0.380 for all Democrats).
On the Republican side, it appears that there are two groups. The more moderate one consists of Reps. Mike Gallagher, Bryan Steil, and Derrick Van Orden. The inclusion of Gallagher in this group was a bit of a surprise because he had acquired a reputation as the least partisan of the Wisconsin delegation. He was the only Republican from Wisconsin to support funding for Ukraine and vote against the impeachment of Homeland Security Secretary Alejandro Mayorkas. This group received an average score around 4, compared to an average of .515 for all Republicans in the Congress.The second group of Republican legislators is much more conservative than the first. It consists of Senator Ron Johnson and Representatives Glenn Grothman, Tom Tiffany and Scott Fitzgerald. The average score for this group is around 6, considerably more conservative than the average Republican.
Historians have gone back to the beginning of the republic, categorizing each roll call vote by the US Congress. The next graph, taken from website, shows the history of the liberal-conservative scale over that time span.
The (almost invisible) gray line represents the median ideology of Congress. It flips back and forth between parties as the parties win and lose elections. The red and blue lines show each party’s median ideology. The dots reflect the range of each party’s ideology.
Since the 1960s, the ideological gap between the two major parties has been widening. Mostly this has been due to the increasing conservatism of the Republican Party. However the Democratic Party has become a bit more liberal.
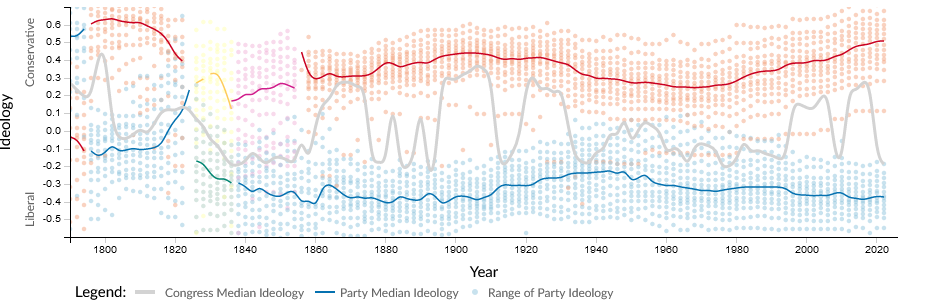
Congress at a Glance: Major Party Ideology. Chart from voteview.com.
Contrast today’s 118th Congress with the ideological makeup of the 90th Congress between 1967 and 1969, shown in the next graph. In this earlier Congress, the two parties overlapped. There were Republicans who were more liberal than the most conservative Democrat, and vice versa.
Examples of the first were some Republican senators in the Northeast, such as Jacob Javits in New York, Clifford Case in New Jersey, and Edward Brooke in Massachusetts. These people are reflected by the red dots on the bottom of the graph.
At the same time, there were numerous Southern conservatives, who were elected as Democrats. These are shown by the blue dots on the top of the chart.
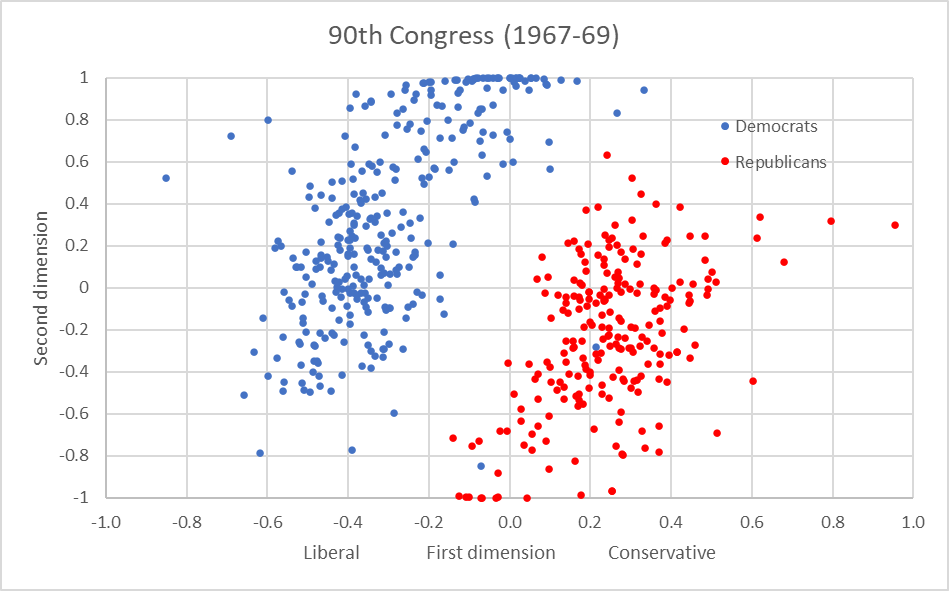
90th Congress (1967-69)
Finally, where does today’s so-called “Freedom Caucus” fit in? An analysis in February of 2022 by the Pew Research Center found that there was no publicly available list of the membership. However, Pew identified 49 House members who were either members of the Freedom Caucus or were closely allied with it. Tom Tiffany is the only caucus member from Wisconsin.
On the next graph, the Freedom Caucus members are shown by black dots. It is not at all surprising that they cluster on the right-hand side of the graph, meaning that they are more conservative than the average Republican House member. It is less clear as to what is the significance, if any, of their concentration at the lower half on the second scale.
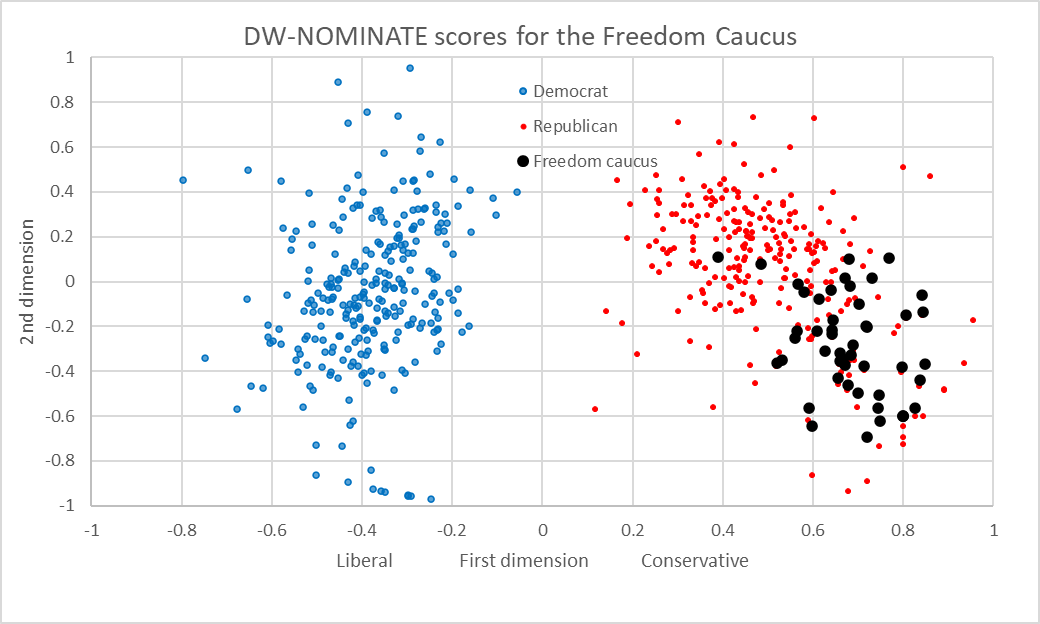
DW-NOMINATE scores for the Freedom Caucus
The DW-NOMINATE scores show the widening gap between the two major parties. Politics at both the national level and in Wisconsin has become more ideological. In particular, the moderate Republican has become an endangered species. I would suggest that there are several factors that contribute to the growing partisan divide.
The partisan primary deserves part of the blame. With typically low turnout, primaries often are dominated by the most ideological voters in both parties. Particularly when combined with gerrymandered redistricting this means that for most elected officials, being primaried by a more extreme opponent is a much greater worry than losing the general election to a member of the other party. For many of these partisans the enemy is the more moderate member of their party.A prominent local example is Robin Vos’ struggles with a group of Republican voters who are under the impression that Donald Trump won the last election which, they conclude, was then stolen from him. The result was that Vos almost lost the most recent Republican primary to a write-in candidate. He subsequently won the general election comfortably.
If you think stories like this are important, become a member of Urban Milwaukee and help support real, independent journalism. Plus you get some cool added benefits.
Data Wonk
-
How Global Climate Change Affects Milwaukee
 Mar 11th, 2026 by Bruce Thompson
-
Will Lawsuits Demanding New Congressional Maps Succeed?
 Mar 4th, 2026 by Bruce Thompson
-
What the 2025 Elections Data Tells Us
 Feb 11th, 2026 by Bruce Thompson