Who Is Most At Risk From Gun Shootings?
The data on Milwaukee tells the story.
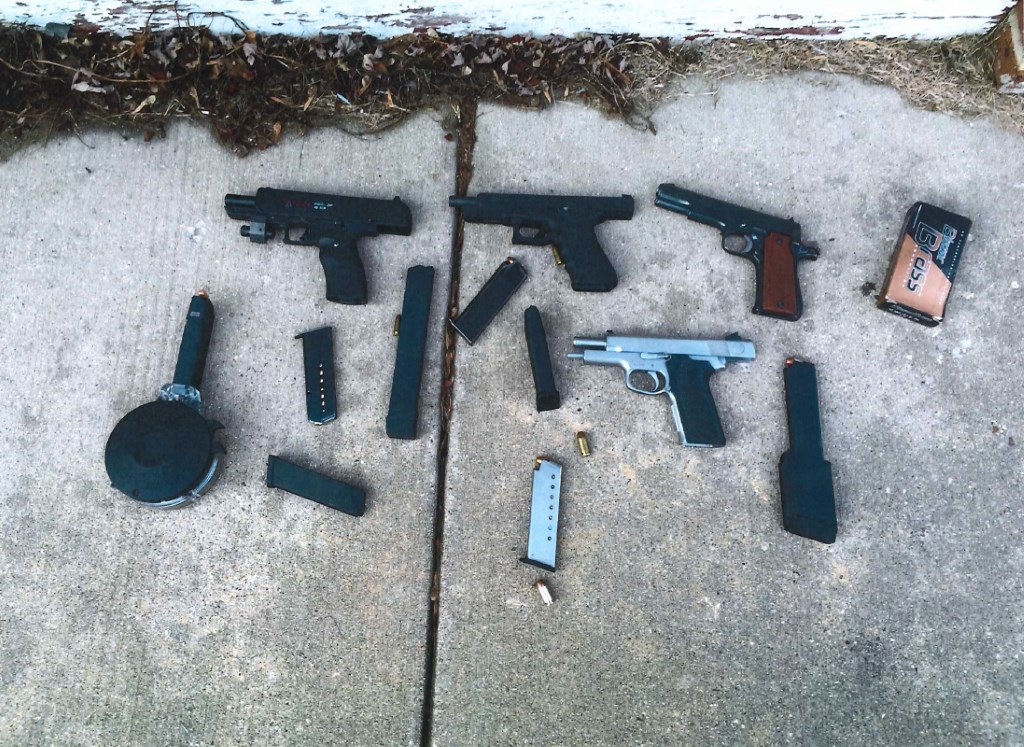
Guns. Photo courtesy of the Milwaukee Police Department.
Three websites report the numbers of homicides in Milwaukee.
One source is a dashboard that is a joint effort of the Medical College of Wisconsin and the Milwaukee Homicide Review Commission. In addition, this site reports on gun shootings that did not result in death, as well as other information on the crime including the weapon used, the suspect if known, the relationship between the victim and the suspect, and what led up to the incident.A second source of data on homicides is a dashboard run by the Milwaukee Police Department. In addition to homicides, this site includes statistics on other crimes.
The third is a database of homicide victims run by the Milwaukee Journal Sentinel. For each of the victims it includes a link to more information on the person and the crime. It also includes links to any newspaper article about the homicide.
What are the long-term trends?
As the graph below shows, homicides doubled in Milwaukee between 2019 and 2020 following four years of gradual decline. While other factors may have been at work, an obvious culprit is the COVID-19 pandemic that hit Wisconsin and the United States in March of 2020, and the subsequent efforts to control it, such as limiting social gatherings and requiring the use of masks when around other people. (Notably the pandemic also seems to have triggered an explosion of very aggressive driving, such as traveling at high speeds in residential areas and using the bike lane for passing.)
Yet for the next two years shootings continued to rise even as vaccines became available and mask mandates and restrictions on gatherings were relaxed and removed. Finally, in 2023 the number of shootings decreased. However, they were still well above the numbers reached in 2019.
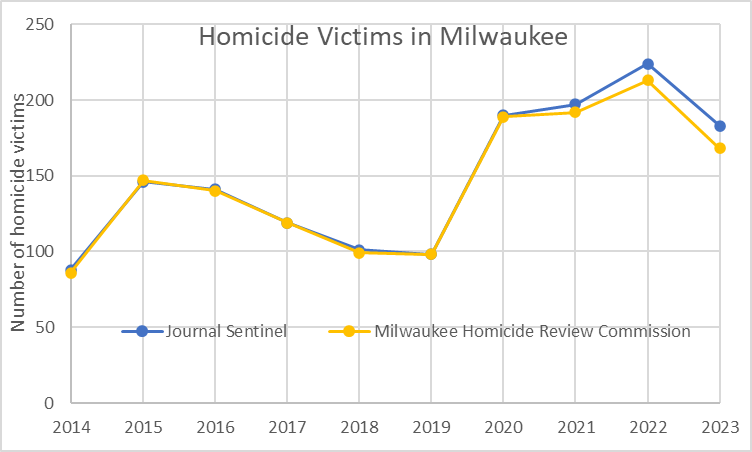
Homicide Victims in Milwaukee
Is the current downward trend sustainable?
Although all three data sources report recent declines in the number of homicides, they disagree substantially on the magnitude of that decline. For the full year change between 2022 and 2023, the percentage varies between 18% and 25%. The estimate of the year-to-date decline ranges from a low of 9% to a high of 36%.
Why are the estimates of change so variable? Part of the explanation may lie with variation in when the three sites were last updated. In any case, Milwaukee is moving in the right direction.
Who is at highest risk of being a homicide victim?
The next graph shows the profiles of the victims (shown in green) of Milwaukee shootings and the suspected shooters (in yellow). In many cases, police are unable to find witnesses or other information that would help identify a suspect, explaining why the green columns are larger than the yellow columns.
The graph shows the number victims of homicides and nonfatal shootings, according to their age, demographics, gender and ethnicity.A common metric in measuring health risks is the rate per 100,000 residents. Applying that metric to Milwaukee census data, a rough calculation suggests that the rate for Black Milwaukee residents being shot in 2023 was 383 per 100,000 residents, compared to 68 for whites. For males, it was 290 compared to 69 for females. For residents between the ages 18 and 29, the rate was 320. For Hispanic residents, it was 93.
Put this together and it identifies who is most likely to be a victim statistically: a Black male in his late teens to late twenties. That person falls in all three of the riskiest demographic groups—for race, age, and gender. Identifying policies to reverse those statistics would seem to be a high priority.
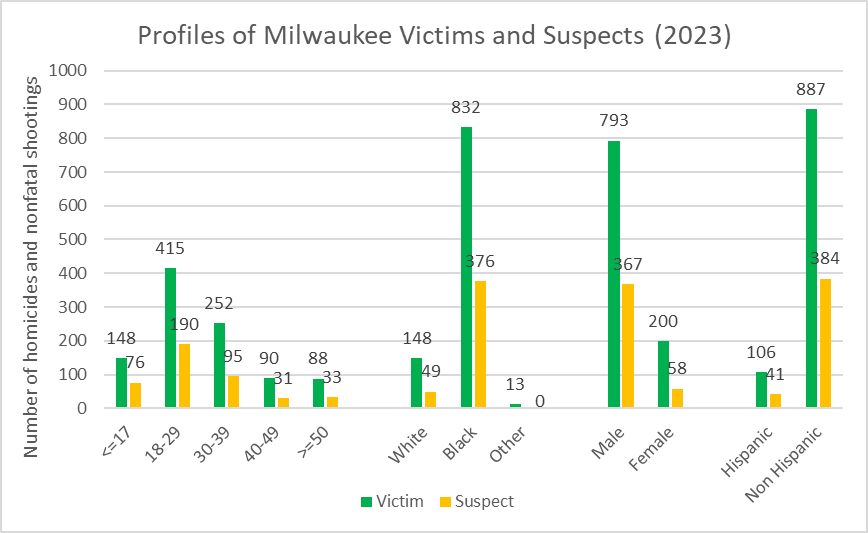
Profiles of Milwaukee Victims and Suspects (2023)
How does geography affect risk?
The risk of gun violence is heavily influenced by where one lives. This effect is remarkably stable over time. The next chart compares the incidence of homicides and nonfatal shootings in 2023, on the horizontal axis, to their incidence in 2022 for each of Milwaukee’s 15 aldermanic districts. The dashed line is the diagonal; districts on that line, such as Aldermanic District 15, had a rate of shootings that was unchanged from one year. Below that line, like with Districts 1 and 2, means that shootings declined.
The data shows the highest rate of homicide for District 15, which includes much of the north-side and south side central city, the district map shows. The lowest homicide rate was in the more sprawling District 11, which includes much of the city’s far-west, far-southwest and far-south neighborhoods, its map shows.
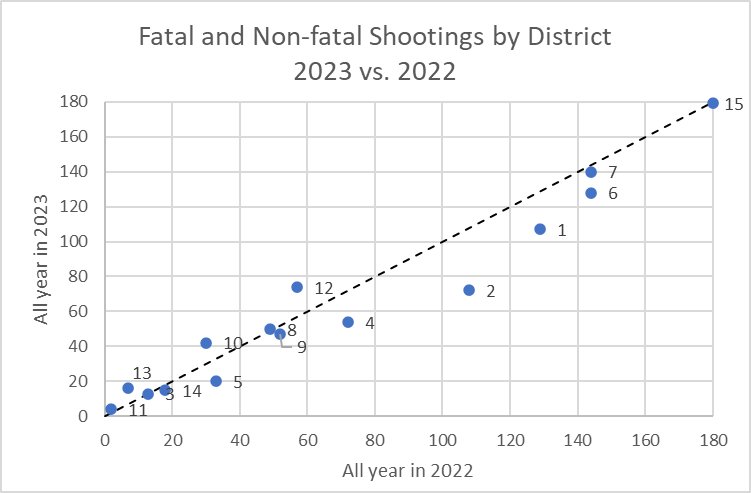
Fatal and Non-fatal Shootings by District 2023 vs. 2022
A great deal of information is collected concerning homicides and other injuries in Milwaukee and across the country. The critical challenge is to use that information to reduce the resulting carnage.
If you think stories like this are important, become a member of Urban Milwaukee and help support real, independent journalism. Plus you get some cool added benefits.
Data Wonk
-
Who Do You Trust to Conduct Elections Fairly?
 Apr 6th, 2026 by Bruce Thompson
-
Is Non-Citizen Voting a Real Threat to Elections in Wisconsin?
Mar 18th, 2026 by Bruce Thompson
-
How Global Climate Change Affects Milwaukee
 Mar 11th, 2026 by Bruce Thompson