7 Takeaways From Milwaukee County’s Reckless Driving Report
One in four traffic fatalities are a bicyclist or pedestrian.

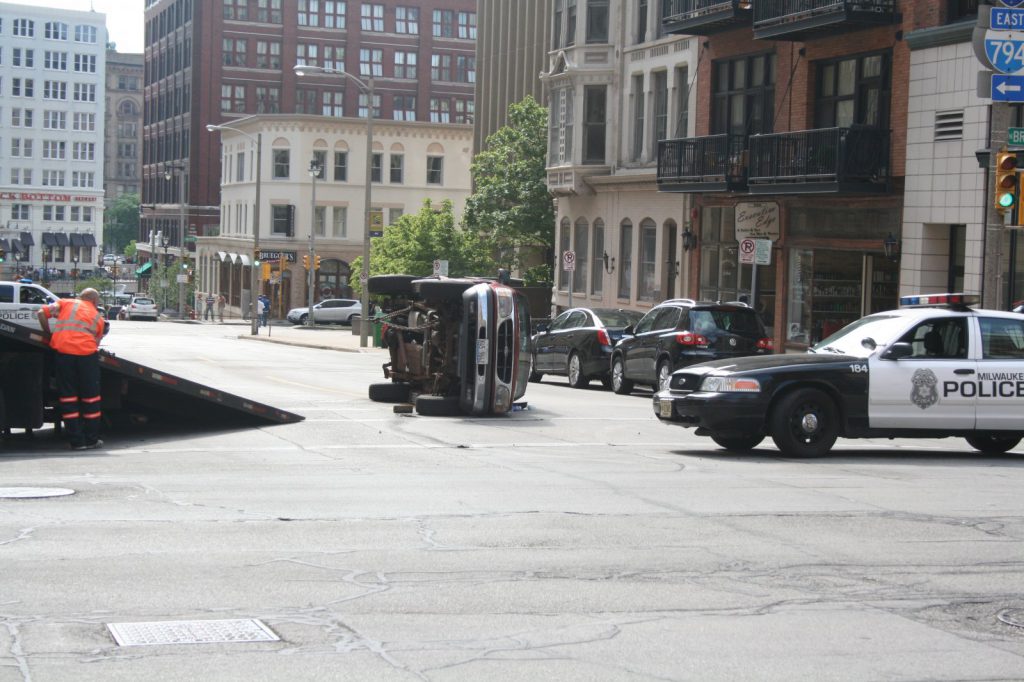
Cleanup after a single-vehicle crash on E. Mason St. Photo by Jeramey Jannene.
A new report shows that Milwaukee drivers have gotten progressively worse over the past decade.
The Milwaukee County Department of Transportation recently completed an assessment of transportation safety across the county. The assessment is part of a larger project that will eventually produce dozens of traffic safety projects across the county, all eligible for federal funding.
“Reckless driving is a pervasive equity issue and a threat to public health,” MCDOT Director Donna Brown-Martin wrote in a forward to the report. “To become the healthiest county in Wisconsin by achieving racial equity, Milwaukee County must address the reasons why severe traffic crashes occur. A collaborative and widespread approach is imperative to identify sustainable solutions.”
The county, along with consultants from MUSE Community + Design, have been collecting data and also community input for this extensive planning effort called the Complete Communities Transportation Planning Project. Once finished, there will be traffic safety projects designed for specific streets, intersections and communities in every municipality in the county. These projects will eventually be eligible for billions in federal funding allocated through the 2021 Bipartisan Infrastructure Law.
1) One in Four Fatal Crashes Involve Bicyclists, Pedestrians
There are, on average, 80 traffic fatalities in Milwaukee County every year, including 20 pedestrians and 3 bicyclists.
Only approximately 1% of motor vehicle crashes cause a fatality or serious injury, but 22% of pedestrian crashes and 11% of bicycle crashes do.
2) 51% of Crashes Occur on 11% of Streets
The assessment found that a majority of vehicle crashes happen on just 11% of the county’s roadways.
Planners also developed a risk score for streets, based on the social vulnerability of the surrounding area, speed limits, roadway configuration and other attributes. The score mapped exactly onto the most dangerous streets in the county, as the 11% of roadways with 51% of crashes also had the highest overall risk.
These high-risk streets also have a crash rate 46.5 times higher than the county’s low-risk streets.
4) Fatal Crashes Have Both Decreased and Increased
Overall, fatal and serious crashes in Milwaukee County remain down compared to the mid-1990s, when a steady, year-over-year decline began. But the trend has changed course beginning in 2014.
Since then, fatal and serious injury crashes have been rising, but the trend would have to continue for some years before it catches up to the crash rate of the 1990s.
5) Milwaukee County Below National Average for Fatal Crashes
The county has fewer fatal crashes annually than the national average. But that may not last long. The rate at which fatal crashes are increasing in the county greatly outpaces the average for the rest of the U.S., which is seeing declines.
6) ‘High Vulnerability’ Areas in Both City and Suburbs Have Most Crashes
“High Vulnerability Census Tracts” within the City of Milwaukee and the outlying suburbs have far more fatal and serious injury crashes than low vulnerability tracts.
The tracts are categorized based on the Centers for Disease Control and Prevention’s (CDC) Social Vulnerability Index, factoring in poverty, language isolation and vehicle access.
“The combination of area type with vulnerable tracts shows that crash disparities aren’t just a function of more land use and development, but also the underlying demographics and needs of the community,” the report stated. “Across all area types, streets in Vulnerable tracts are two times as likely to have a fatal or serious injury crash.”
Black and American Indian residents have disproportionately higher rates of fatal and serious injury crashes, as Urban Milwaukee previously reported.
7) Direct Relationship Between Traffic Volume and Fatalities
As traffic increases, so does the rate of serious and fatal crashes.
“There is a very direct relationship between traffic volumes and crash risk,” the report concluded. “Streets with fewer than 5,000 vehicles per day (about 76% of the County’s surface streets) had about average risk. Roadways with more than 5,000 vehicles per day had a higher than average risk.”
Read the full Transportation Safety Assessment Report on Urban Milwaukee.
If you think stories like this are important, become a member of Urban Milwaukee and help support real, independent journalism. Plus you get some cool added benefits.
MKE County
-
Prosecution Rests Case in Dugan Trial
 Dec 17th, 2025 by Graham Kilmer
-
Chief Judge Questioned About ICE Policy, Texts, Emails in Dugan Trial
 Dec 17th, 2025 by Graham Kilmer
-
Fellow Judge Testifies in Dugan Case
 Dec 16th, 2025 by Graham Kilmer
Transportation
-
Congestion Pricing Cuts Air Pollution in New York City
 Dec 14th, 2025 by Jeff Wood
-
FTA Tells Milwaukee to Crack Down on Fare Evasion — Even Where Fares Don’t Exist
 Dec 12th, 2025 by Graham Kilmer
-
Will GOGO’s Bus Service Ever Get Going?
 Dec 9th, 2025 by Jeramey Jannene


Conspicuous absence: Names of streets!! The referenced “Transportation Safety Assessment Report” mentions these streets in generalality: Capital, Fond du Lac, Kinnickinnic, Good Hope, Silver Spring, National, North, Lincoln, Lake Drive (but not Lincoln Memorial Dr), and S. 27th St (Layton Blvd).
Not sure I read this right, but it seems to say that 1% of car crashes lead to death/serious injuries. I’d like to know:
How many were the result of police chases.
How many drivers weren’t wearing seatbelts.
How many were motorcyclists not wearing helmets.
Cars driven recklessly become lethal weapons as deadly as guns. Until we start treating enforcement and penalties as such, this indiscriminate behavior will continue. We don’t need more studies & education. The time is now to get serious, including treating teen juvenile offenders as adults.