
Supreme Court Should Have Consultants Draw New District Maps
Data shows all suggested maps tilt Republican and fairer maps can be drawn.
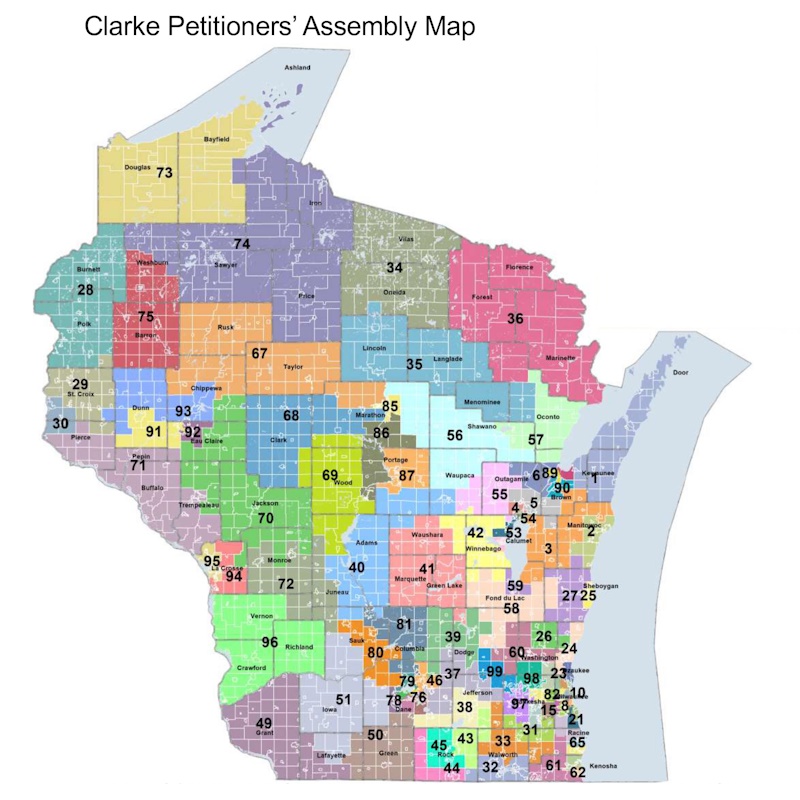
Clarke Petitioners’ Assembly Map
The report from the Wisconsin Supreme Court‘s redistricting consultants by professors Jonathan Cervas and Bernard Grofman does an admirable job of evaluating the plans offered by the parties to the lawsuit challenging the Wisconsin gerrymander. On page 24 of the report, the consultants offer to develop a better plan:
The Court can instruct us to take one or more of the plans and improve it with respect to one or more of the court-mandated criteria. Or the Court can instruct us to draw on more than one of the proposed maps and offer the Court a map intended to improve performance on most or all of the Court mandated criteria. In the process of reviewing plans, we have done extensive explorations of the geography of Wisconsin, and we are confident that we can do so. If the Court were to instruct us to create such a map, we are poised to produce it quickly.
The Court should accept the consultants’ offer. Let me explain why.
Following the Court’s instructions, the consultants looked at six plans proposed by the parties. Two of these—the first proposed by the Republican Legislature and the second called the Johnson Intervenors — came from advocates of the current Wisconsin map that heavily favored Republicans. The first was essentially a revised version of the current plan with non-contiguous parts of districts removed. By contrast, the Johnson plan was a new one that claimed to have been created without taking data on voting into account.The other four plans aimed at eliminating, or at least reducing, the gerrymander. These came from Governor Tony Evers, Democratic Senators, and two groups of voters, called the Clarke and Wright plans.
The report first looked at what it calls the “good government issues,” including:
- Compliance with population equality requirements.
- The extent to which assembly districts split counties, towns, and wards.
- Whether districts are composed of contiguous territory.
- Whether districts are drawn in as compact form as practicable.
- Whether districts comply with the Equal Protection Clause and the Voting Rights Act of 1965.
- The extent to which districts preserve “communities of interest.”
Overall, the consultants concluded that the six redistricting plans perform satisfactorily on the good government issues. They noted, however, that the Johnson map has the greatest number of ward splits in both maps, adding that the Johnson briefs argued that they placed little weight on ward splits because wards would be redrawn once new maps are in place.
The consultants expressed concern about the “communities of interest” issue: “These types of claims are hard to evaluate and may be disguised ways of justifying plan elements that have a partisan or incumbent protection motive.”
The consultants then looked at the extent to which a plan is politically neutral, i.e., that it does not favor either party over the other. They offer three measures of political neutrality, including:
- The mean minus median gap, the difference between the average (mean) vote share in each district and the vote share for that same party in the median (middle) district using the two-party vote. “A gap between the two indicates that there is an asymmetry between the parties in translating their vote into seats.”
- Partisan bias, the difference in expected seat shares if each party receives half the two-party votes.
The following graph has a scatter plot that compares the mean minus median gap (on the vertical axis) to partisan bias (on the horizontal axis). Maps for Assembly seats are shown in green; those for state Senate in yellow. By custom, gaps favoring Republicans are shown as negative numbers; those favoring Democrats as positive.
With one exception, all the values are negative, meaning that the plans make it more difficult for Democrats to win a majority of seats than Republicans. The only plan that favors Democrats is the Senate Democrats’ plan for the Senate.
The first two dots in the lower left-hand corner of the chart represent the Senate and Assembly plans from the Legislature. These are very similar to the present maps adopted two years ago. These, in turn were based on the Republican extreme gerrymander following the 2010 Census.The next two dots represent the Johnson plans. Apparently, they were developed by the conservative Wisconsin Institute for Law and Liberty. In their briefs, they claim to have been developed without the use of data on past voting practices. Although less biased in favor of Republicans than the Legislature plan, they would make it nearly impossible for Democrats to win either chamber.
The consultants refer to these plans as stealth gerrymanders, meaning plans that look on their face to be good maps in that they satisfy to a considerable degree traditional good government criteria yet exhibit an extreme level of partisan bias. Justices who pride themselves on being nonpartisan should not adopt a gerrymander favoring one party, whether stealthy or not.
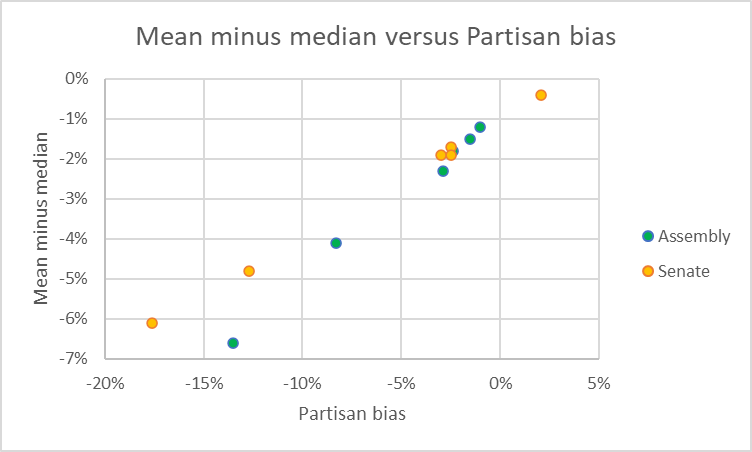
Mean minus median versus Partisan bias
The third measure of political neutrality is called the “Majoritarian Concordance.” It counts the percentage of elections in which the party that won a statewide election also won a majority of district seats. The chart below shows the results for the 13 past elections used by the consultants. The Assembly and Senate elections for the district maps from the Legislature and the Johnson group all have a concordance of 38%, that candidate that won the statewide vote also won most districts only 38% of the time.
This is due mainly to the fact that under these plans, Republicans won most districts in every election but one, regardless of the statewide results. The exception is the 2018 election for US Senator, in which Tammy Baldwin received 55.4% of the vote, enough to win a majority of legislative districts.
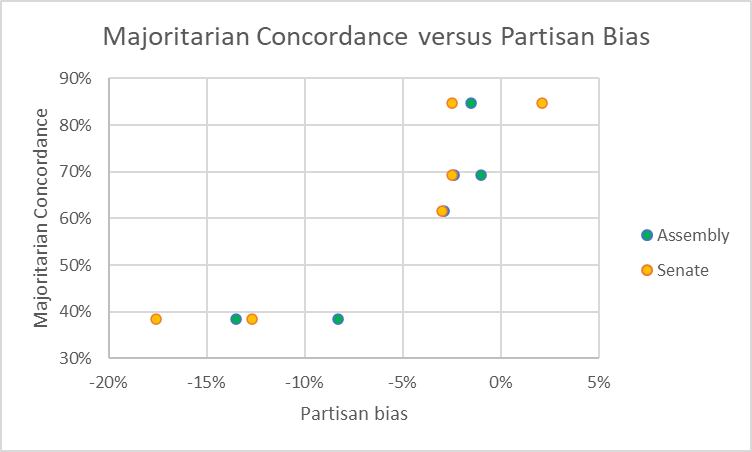
Majoritarian Concordance versus Partisan Bias.
In summary, when the Democrats win the most votes, they have a good chance of winning the most seats with the Clarke, Democratic Senators, Governor Evers, and Wright proposals. However, under the Legislature’s and Johnson proposals, Dems are unlikely to win the most districts even if they win the most votes statewide.
The correlation coefficient between the partisan bias obtained by the consultants and the proportionality calculated by the website Dave’s Redistricting App (DRA) was .95. Although very strong, it is not perfect.
Part of the difference between the two measures is likely due to a difference in the number of elections each used in their calculations. DRA used six elections: the 2016 and 2020 presidential elections, the 2016 and 2020 elections for U.S. Senator, and the 2022 election for governor and attorney general for a total of 12 data points when both Assembly and state Senate results are counted. By contrast, the consultants used 13 state-wide elections.
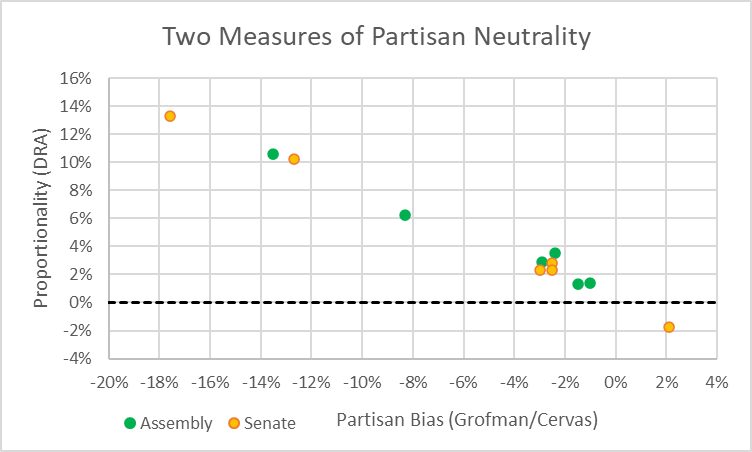
Two Measures of Partisan Neutrality.
The next chart shows the proportionality the DRA calculated for the four plans not described as stealth gerrymanders–the Wright, Clark, Democratic Senators, and Evers plans. The horizontal axis shows each group’s Assembly plan and the horizontal axis each plan’s Senate plan. Based on the convention that plans shown with positive gaps are biased to Republicans, only the Democratic Senate plans favors Democrats. The closer a plan’s score is to zero, the likelier it is that a party winning a statewide vote would also win a majority of districts.
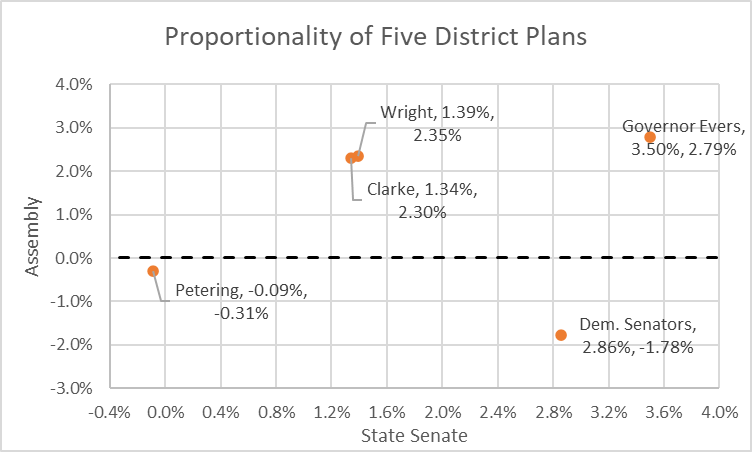
Proportionality of Five District Plans.
Although these plans are a vast improvement over the Legislature and Johnson plan, they still fall short when it comes to eliminating bias. For example, under the Wright plan, arguably the least biased of the four, the Democrats chance of winning a proportional seat share in the Assembly would be only 27.9% and 38.5% in the Senate, according to calculations that UWM engineering professor Matthew Petering included in his amicus brief to the Court.
Could a more neutral plan be developed? A plan developed by Petering and shown on the chart above suggests that improvement is possible. At the end of their report, Grofman and Cervas make their offer to further develop a plan. Given the importance of the Supreme Court’s decision, accepting the offer would be a wise — and judicious — decision.
More about the Gerrymandering of Legislative Districts
- Without Gerrymander, Democrats Flip 14 Legislative Seats - Jack Kelly, Hallie Claflin and Matthew DeFour - Nov 8th, 2024
- Op Ed: Democrats Optimistic About New Voting Maps - Ruth Conniff - Feb 27th, 2024
- The State of Politics: Parties Seek New Candidates in New Districts - Steven Walters - Feb 26th, 2024
- Rep. Myers Issues Statement Regarding Fair Legislative Maps - State Rep. LaKeshia Myers - Feb 19th, 2024
- Statement on Legislative Maps Being Signed into Law - Wisconsin Assembly Speaker Robin Vos - Feb 19th, 2024
- Pocan Reacts to Newly Signed Wisconsin Legislative Maps - U.S. Rep. Mark Pocan - Feb 19th, 2024
- Evers Signs Legislative Maps Into Law, Ending Court Fight - Rich Kremer - Feb 19th, 2024
- Senator Hesselbein Statement: After More than a Decade of Political Gerrymanders, Fair Maps are Signed into Law in Wisconsin - State Senate Democratic Leader Dianne Hesselbein - Feb 19th, 2024
- Wisconsin Democrats on Enactment of New Legislative Maps - Democratic Party of Wisconsin - Feb 19th, 2024
- Governor Evers Signs New Legislative Maps to Replace Unconstitutional GOP Maps - A Better Wisconsin Together - Feb 19th, 2024
Read more about Gerrymandering of Legislative Districts here
Data Wonk
-
Who Do You Trust to Conduct Elections Fairly?
 Apr 6th, 2026 by Bruce Thompson
-
Is Non-Citizen Voting a Real Threat to Elections in Wisconsin?
Mar 18th, 2026 by Bruce Thompson
-
How Global Climate Change Affects Milwaukee
 Mar 11th, 2026 by Bruce Thompson


I’m confident Gov EVERS will Veto unfair maps.
Independent Consultants must be draw neutral Maps.