Liberals Winning State Supreme Court Races
They’ve now won three of last four races by big margins. What the data shows.
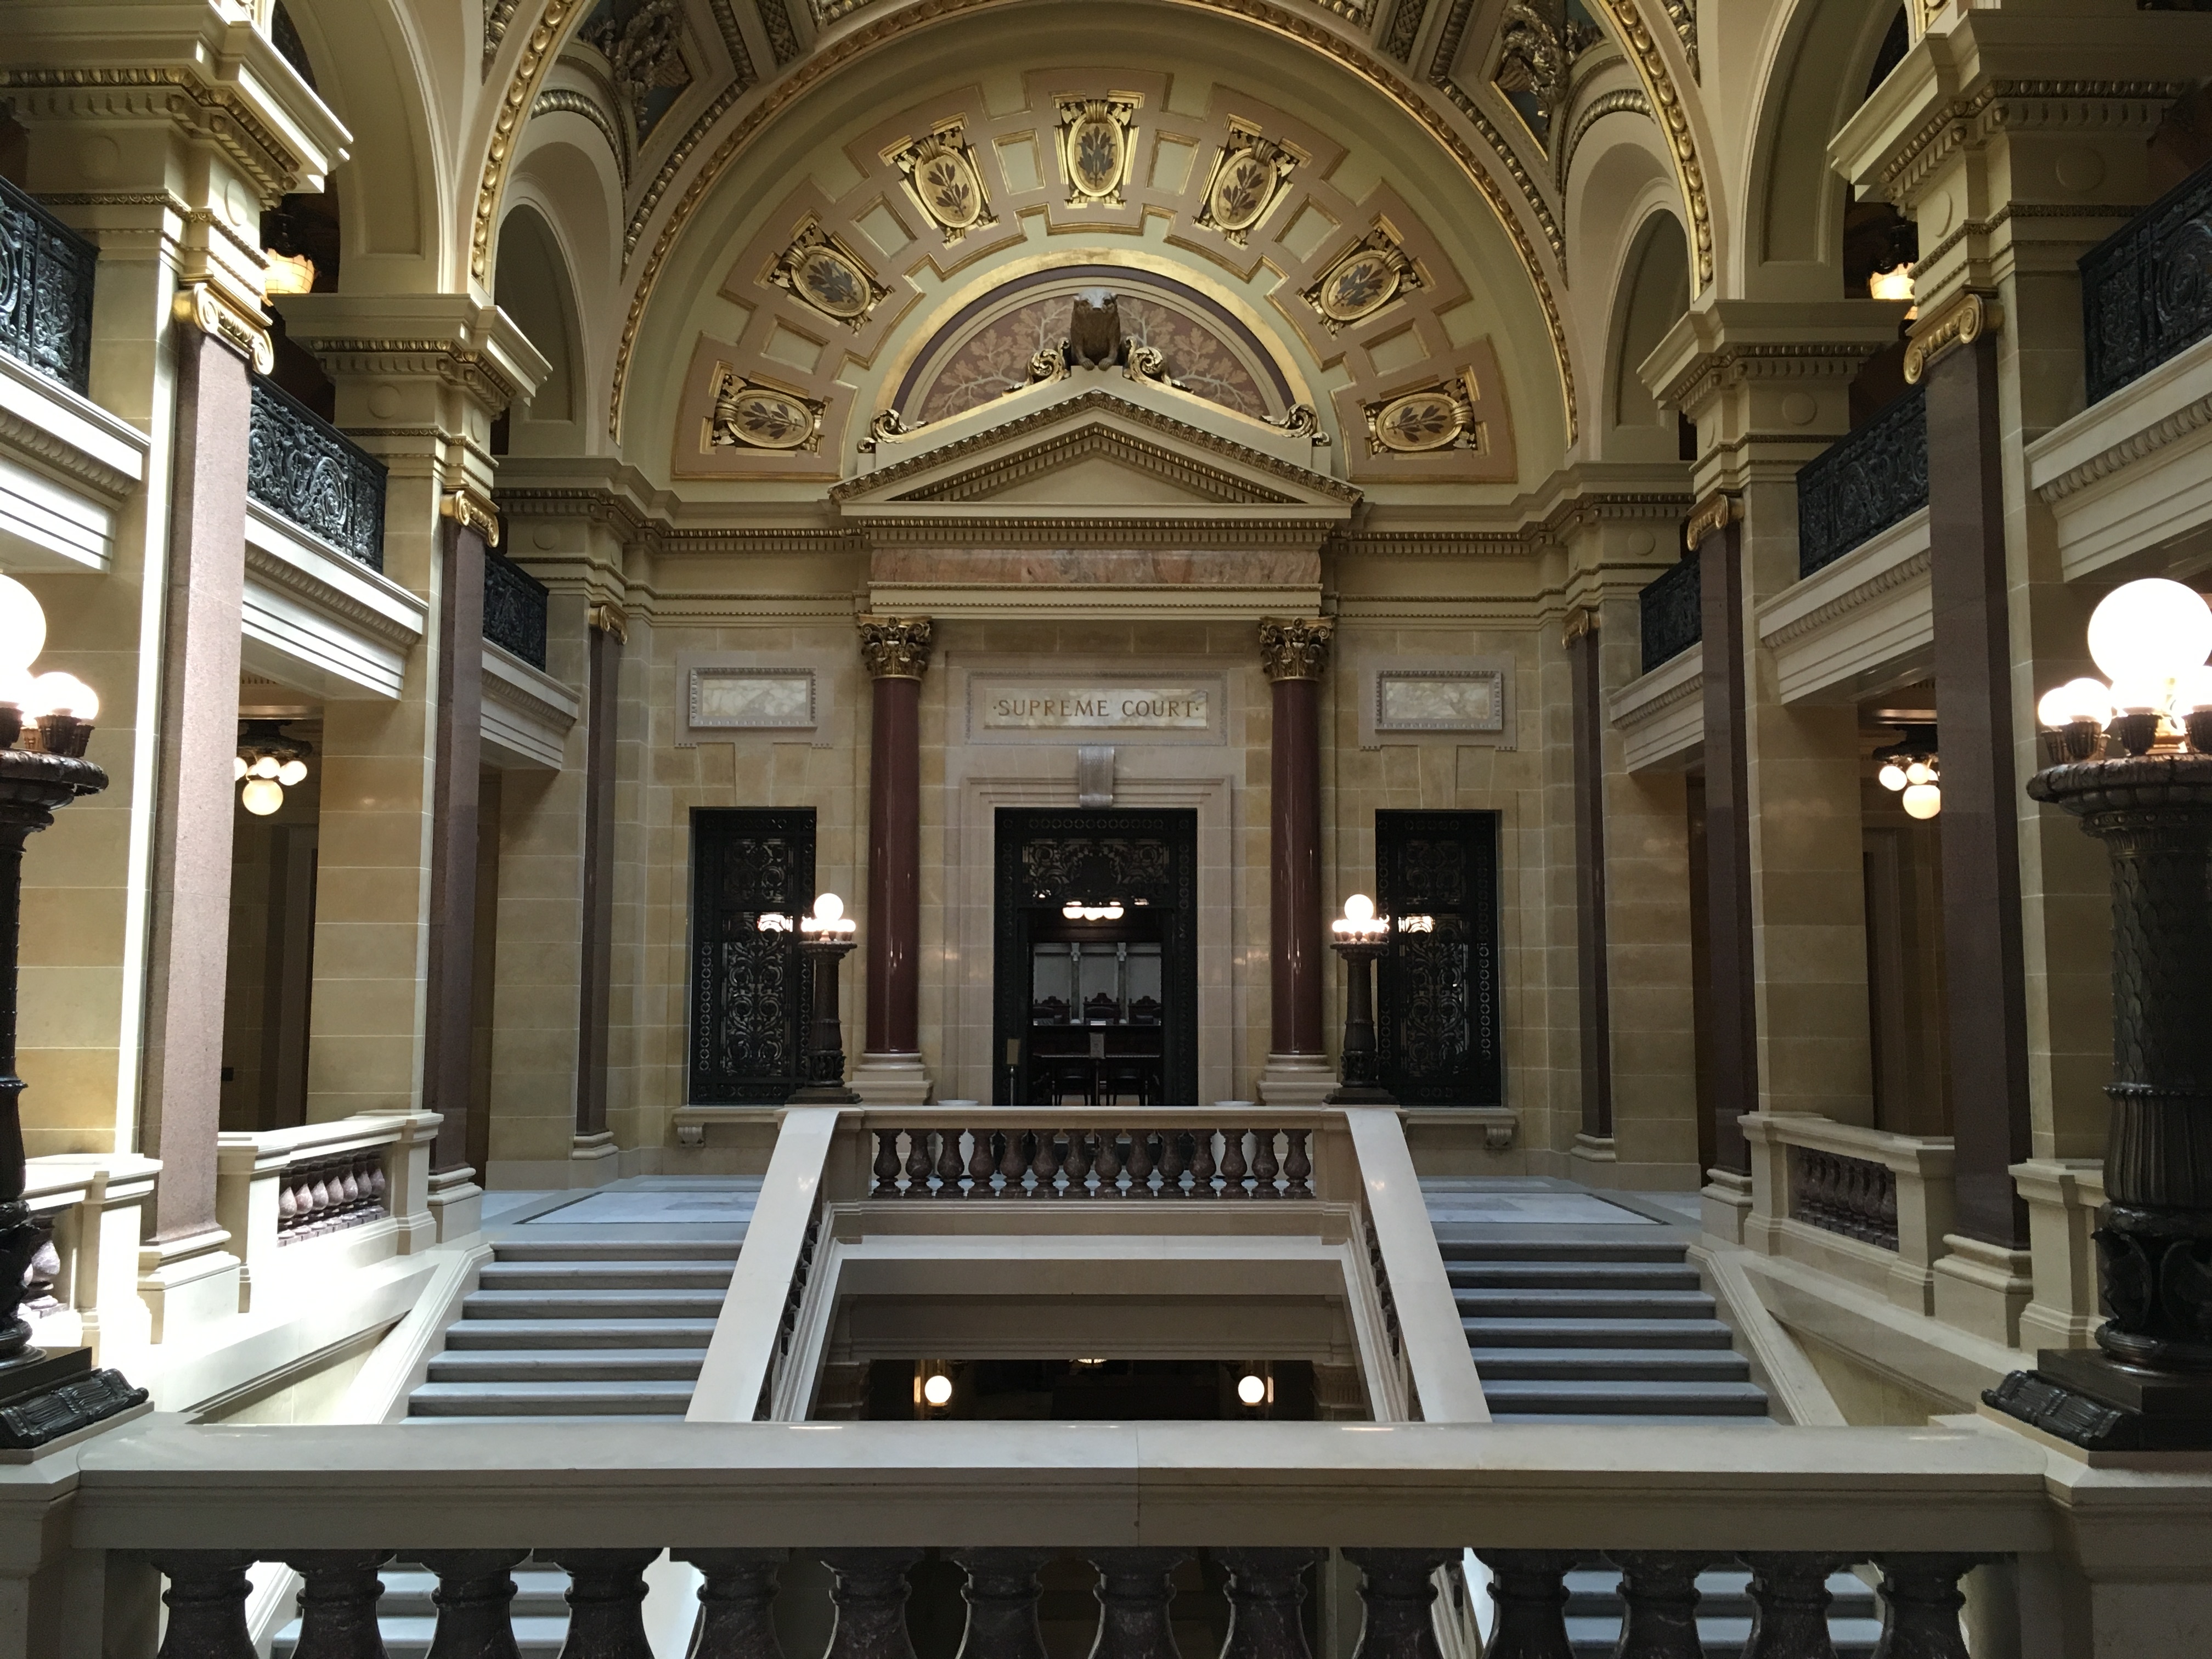
Wisconsin Supreme Court. Photo by Mariiana Tzotcheva.
This is the first of four columns examining the implications of the spring election for Wisconsin Supreme Court justice. This one analyzes the vote count itself. Future columns will look at the court’s conservative justices’ hostility towards expertise, the state’s back-tracking on measures of democracy, and the implications for Wisconsin’s political parties and elections.
Janet Protasiewicz’s 11-point margin of victory over Dan Kelly in this year’s state Supreme Court election has drawn considerable attention. Yet, as shown in the graph below, big margins have been the common story in the last four elections. In three of the last four elections, the liberal candidate enjoyed margins around eleven points.The only exception is the 2019 election in which Brian Hagedorn, the conservative candidate, managed to eke out a 6,000-vote victory over Lisa Neubauer. The most widely accepted explanation was that supporters of Neubauer over played their hand: their attacks on Hagedorn motivated more conservatives to vote.
In 2017, incumbent conservative Justice Annette Ziegler ran unopposed. In 2021 and 2022, there were no Supreme Court elections. Since the seven justices each serve ten-year terms there is no election in three of every ten years. 2024 will be another off year for supreme court elections.
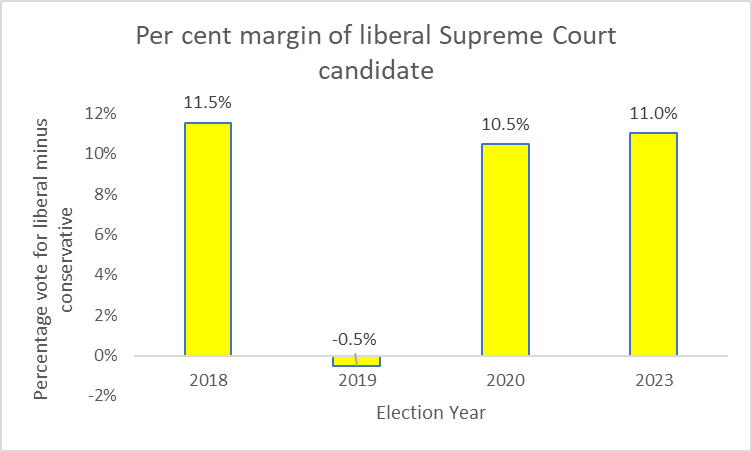
Per cent margin of liberal Supreme Court candidate
The more striking trend in the voting pattern is the dramatic increase in the total vote from one election to the next. Both the liberal and the conservative candidates have received more votes than their predecessors did.
Particularly notable is the 2020 election for supreme court justice. Both Wisconsin Democratic and Republican presidential primaries were scheduled for the same election. Fearing that the presidential primary would serve to drive more Democrats to the polls, Republican legislators tried to move the court election to another day. That attempt failed when it became evident that there was not enough time to fit in three primary and general elections.Both liberal and conservative votes did indeed increase compared to the 2019 election. Dan Kelly, who had been appointed by Governor Scott Walker to fill out the unexpired term of Justice David Prosser, was defeated in his attempt to win a full ten-year term on the court, fulfilling Republican fears. Nevertheless, this spring with no presidential primary, Kelly lost again.
Turning to local voting, the spring election gives further evidence of weakening conservative/Republican support in Milwaukee and its suburbs. As the next graph shows, of the so-called WOW counties (Waukesha, Ozaukee, and Washington), the shift has most progressed in Ozaukee County, where several communities are now majority liberal/Democratic.
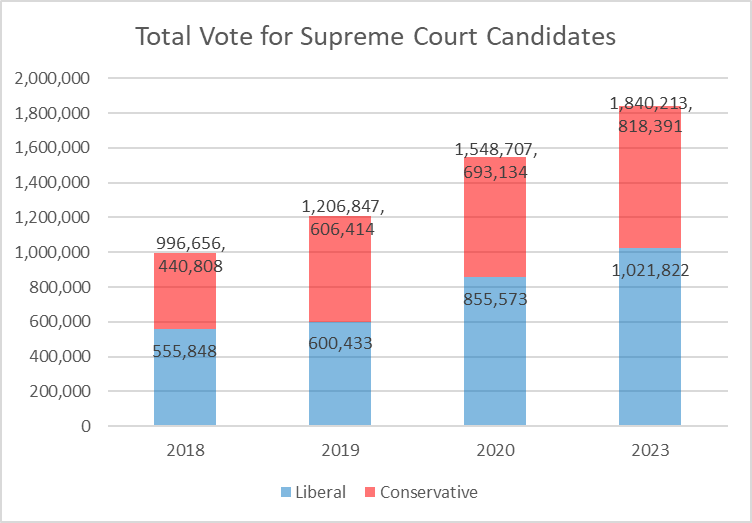
Total Vote for Supreme Court Candidates
The next graph shows the trend over time, covering the most recent four supreme court elections. This chart shows the percentage of the total major candidate vote that went to the liberal candidate. (Throughout this analysis, I ignore write-ins votes, which were very small.)
Note that compared to the 2020 vote, the percentage of the vote going to the liberal candidate in Milwaukee and its three suburban counties rose in the 2023 election. In contrast, the state-wide percentage (shown in black) was essentially flat.
This means that the liberal candidate percentage went down in other parts of Wisconsin.
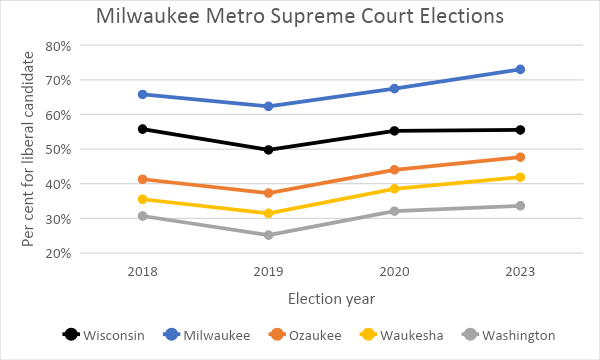
Milwaukee Metro Supreme Court Elections
What accounts for the substantial differences in voting from one county to another? Urbanization is certainly one factor. The next graph compares the percentage vote for Protasiewicz (on the vertical axis) to each county’s population density (on the horizontal). Milwaukee and Dane counties stand out for both their high population density and their heavy support for Protasiewicz. In fact, to avoid squeezing most Wisconsin counties into the left side I used a logarithmic scale for population density in which each unit is ten times its predecessor. This allows the graph to show the state’s densest counties, Milwaukee and Waukesha, on the same graph as Wisconsin’s many rural counties.

Counties: Vote versus Population Density
The next chart shows the voting pattern of Wisconsin’s least populated counties, those with a population density of 100 people per square mile or less. Consider two of the counties in the state’s far north: Bayfield with a population density of 11 and Florence with a density of 10. Despite their similarities, their election choices were quite different. 70% of Florence County voters chose Kelly; while Protasiewicz won 64% of Bayfield votes.
As the next graph shows, geography is not destiny. Voters is seemingly similar counties often made very different choices in whom to support.
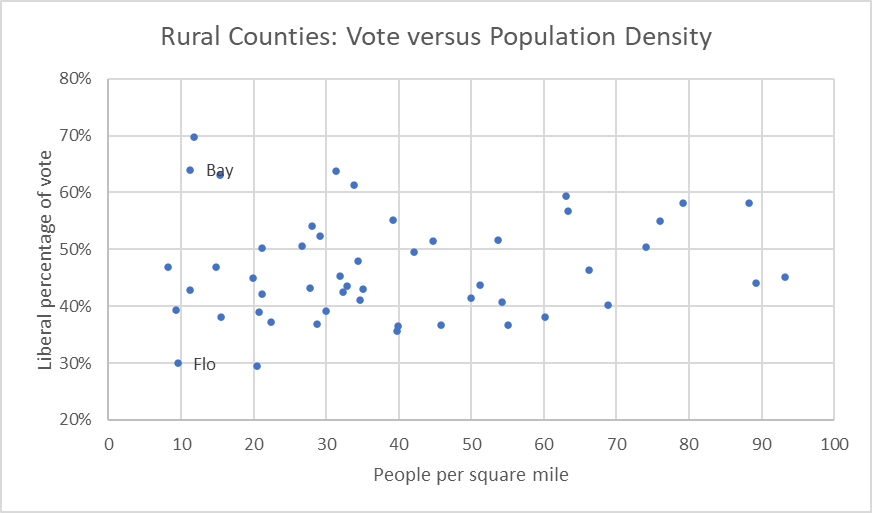
Rural Counties: Vote versus Population Density
Understanding why superficially similar voters made such different choices will be useful in future elections.
Data Wonk
-
Who Do You Trust to Conduct Elections Fairly?
 Apr 6th, 2026 by Bruce Thompson
-
Is Non-Citizen Voting a Real Threat to Elections in Wisconsin?
Mar 18th, 2026 by Bruce Thompson
-
How Global Climate Change Affects Milwaukee
 Mar 11th, 2026 by Bruce Thompson