State’s Past Votes Could Foretell 2020 Result
Wisconsin has had two kinds of presidental elections. Which one this time?
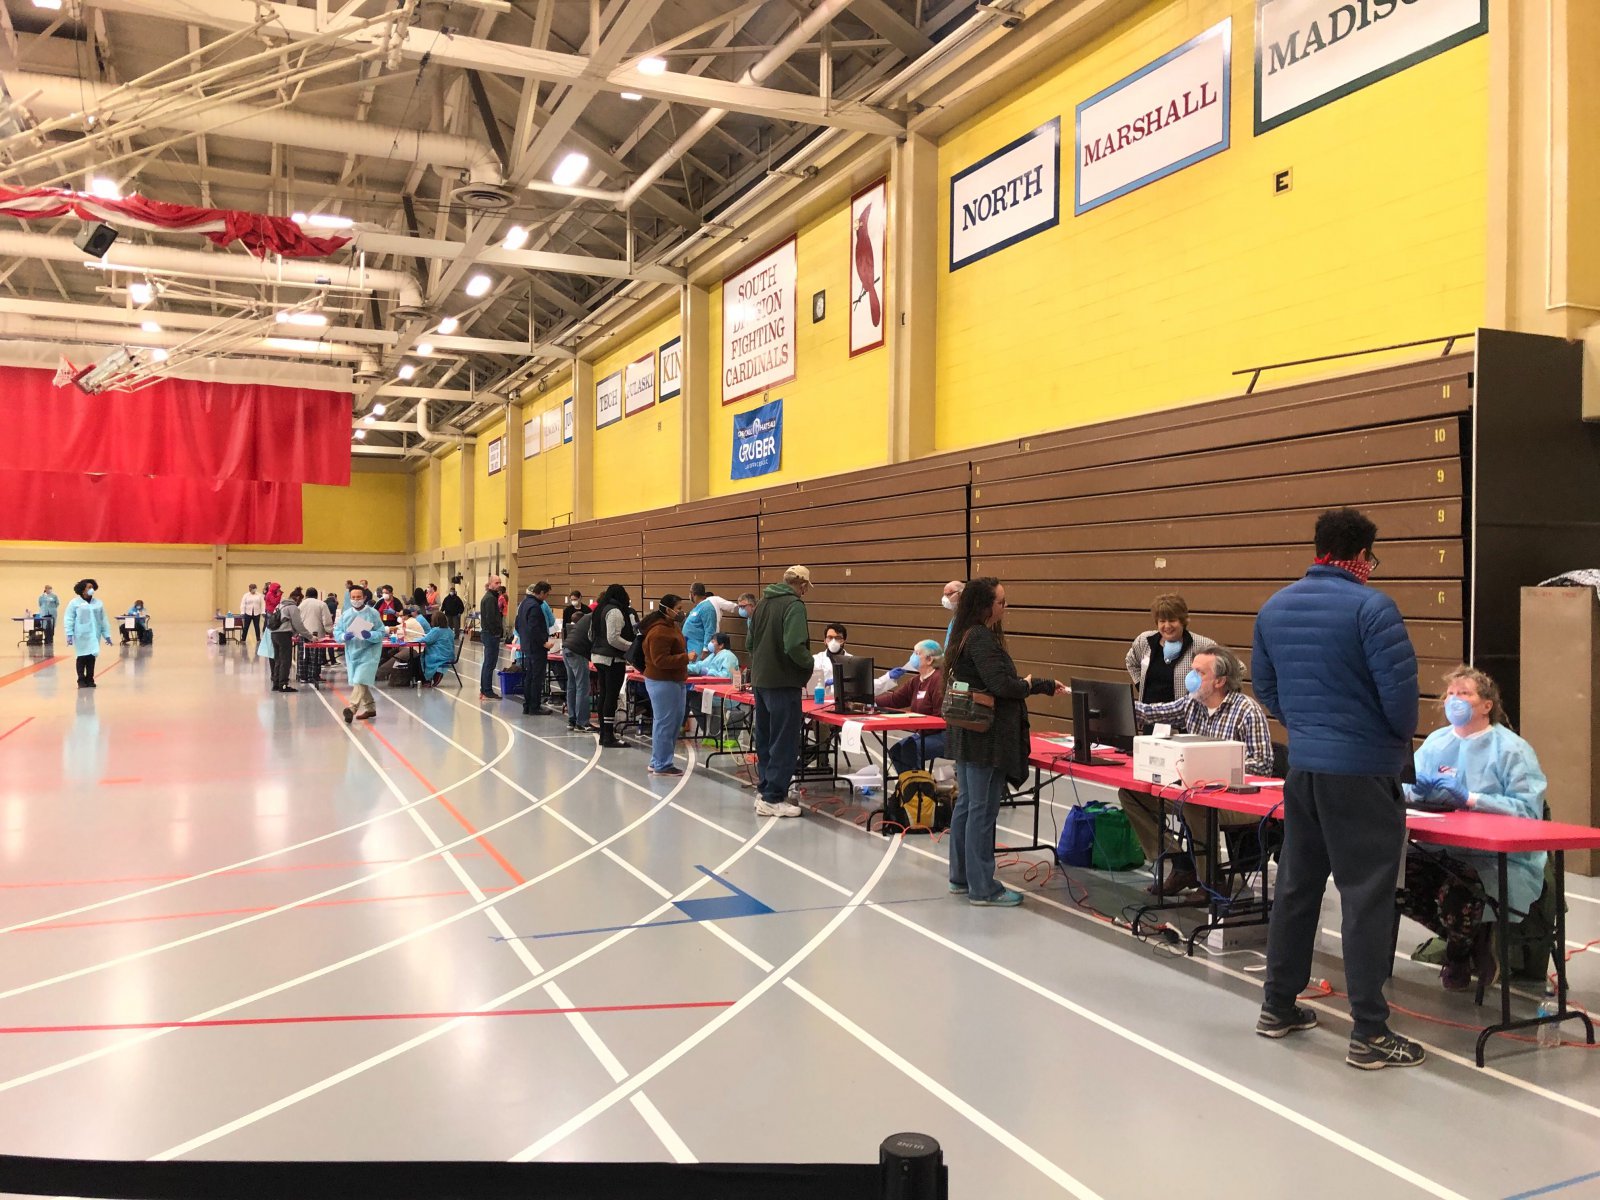
Voters at South Division High School. File photo by Jeramey Jannene.
If you’re watching the election results come in Tuesday night — and likely well into Wednesday — and you’re wondering how Milwaukee and Wisconsin has voted in the past, here’s a rundown the last 20 years of presidential election results.
Both the City of Milwaukee and Milwaukee County historically are Democratic strongholds, even in years when Republican candidates win the state and or the presidency. Only once during the past 20 years has less than 70% of the city gone to a Democratic candidate — Al Gore in 2000 with 67.6% of the vote.
Still, some voting trends visible statewide also show up in Milwaukee.
Specifically, low voter enthusiasm. When turnout is low across the state, it’s usually low in Milwaukee. And, between 2000 and 2016, whenever turnout was lowest, third party voting went up, suggesting low approval of candidates running on the tickets for the two major parties.
In 2004, 2008, and 2012, third party candidates didn’t manage to get even 1% of the vote in the city, county or the state. But in 2000 and 2016, the two elections in recent years with the lowest turnout, third party candidates did much better. In 2000, Green Party candidate Ralph Nader won more than 3% of the vote in the city, county and state. And in 2016, Libertarian Candidate Gary Johnson won 2.5% of the vote in the city, 3% in the county and 3.6% in the state. Green Party Candidate Jill Stein won just over 1% in the city, county and state.In the last 20 years, former President Barack Obama is the only presidential candidate to win Wisconsin with a majority of votes. He won 56% in 2008 and 52% in 2012. President Donald Trump won the state with a plurality. That is, he had the highest number of votes, but fell short of a majority.
It is because Wisconsin, like most of the U.S., assigns its electoral votes based upon a plurality, not a majority, that in American politics third party candidates are historically described as “splitting the vote.” This is the result, statistically speaking, when third party votes reduce the probability that a major party candidate with similar views wins. It’s no coincidence that when Obama twice won with a majority of votes third party candidates didn’t even crack 1 percent.
Turnout and third party votes appear inversely correlated in recent elections. When turnout goes down, third party voting goes up. Trump won Wisconsin in 2016 with fewer votes than Sen. Mitt Romney had in 2012 — when he lost. Voter turnout was down in the city, county and the state in 2016. More than 92,000 fewer Wisconsinites voted during that election than the previous one.
If history is any guide, the third party vote will be lower for this election as the turnout is expected to be very high in Wisconsin (along with the nation), perhaps hitting historic levels. Which suggests the winning candidate will win a majority, not a plurality of the vote in Wisconsin.
2016
City of Milwaukee
| Votes | % of Votes | |
| Donald Trump | 45,411 | 18.43 |
| Hillary Clinton | 188,657 | 76.55% |
| Gary Johnson | 6,254 | 2.54% |
| Jill Stein | 2,689 | 1.09% |
| Ballots Cast | 247,836 |
Milwaukee County
| Votes | |
| Donald Trump | 125,846 |
| Hillary Clinton | 288,797 |
| Gary Johnson | 13,590 |
| Jill Stein | 4,529 |
| Ballots Cast | 440,247 |
State of Wisconsin
| Votes | % of Votes | |
| Donald Trump | 1,405,284 | 47.22% |
| Hillary Clinton | 1,382,536 | 46.45% |
| Gary Johnson | 106,674 | 3.58% |
| Jill Stein | 31,072 | 1.04% |
| Ballots Cast | 2,976,150 |
2012
City of Milwaukee
| Votes | % of Votes | |
| Barack Obama | 227,384 | 79.27% |
| Mitt Romney | 56,553 | 19.72% |
| Ballots Cast | 288,459 |
Milwaukee County
| Votes | |
| Barack Obama | 332,438 |
| Mitt Romney | 154,924 |
| Ballots Cast | 492,576 |
State of Wisconsin
| Votes | % of Votes | |
| Barack Obama | 1,620,985 | 52.83% |
| Mitt Romney | 1,407,966 | 45.89% |
| Ballots Cast | 3,068,434 |
2008
City of Milwaukee
| Votes | % of Votes | |
| Barack Obama | 213,436 | 77.82% |
| John McCain | 57,665 | 21.03 |
| Ballots Cast | 275,042 |
Milwaukee County
| Votes | |
| Barack Obama | 319,819 |
| John McCain | 149,445 |
| Ballots Cast | 475,192 |
State of Wisconsin
| Votes | % of Votes | |
| Barack Obama | 1,677,211 | 56.22% |
| John McCain | 1,262,393 | 42.31% |
| Ballots Cast | 2,983,417 |
2004
City of Milwaukee
| Votes | % of Votes | |
| George W. Bush | 75,746 | 27.35% |
| John Kerry | 198,907 | 71.83% |
| Ballots Cast | 277,535 |
Milwaukee County
| Votes | |
| George W. Bush | 180,287 |
| John Kerry | 297,653 |
| Ballots Cast | 482,236 |
State of Wisconsin
| Votes | % of Votes | |
| George W. Bush | 1,478,120 | 49.32% |
| John Kerry | 1,489,504 | 49.7% |
| Ballots Cast | 2,997,007 |
2000
City of Milwaukee
| Votes | % of Votes | |
| George W. Bush | 69,075 | 28.21% |
| Al Gore | 165,598 | 67.64% |
| Ralph Nader | 8,062 | 3.29% |
| Ballots Cast | 245,670 |
Milwaukee County
| Votes | |
| George W. Bush | 163,491 |
| Al Gore | 252,329 |
| Ralph Nader | 13,953 |
| Ballots Cast | 433,537 |
State of Wisconsin
| Votes | % of Votes | |
| George W. Bush | 1,237,279 | 47.61% |
| Al Gore | 1,242,987 | 47.83% |
| Ralph Nader | 94,070 | 3.62% |
| Ballots Cast | 2,598,607 |
If you think stories like this are important, become a member of Urban Milwaukee and help support real, independent journalism. Plus you get some cool added benefits.
More about the 2020 General Election
- FBI Knocks, Milwaukee Answers With Two New Law Firms On Its Side - Jeramey Jannene - Jun 2nd, 2026
- FBI Wants to Interview Milwaukee Police Officers Related to 2020 Election - Jeramey Jannene - May 21st, 2026
- MKE County: FBI Visits Milwaukee County Elections Director - Graham Kilmer - May 14th, 2026
- Senator Agard Statement on Senator Knodl’s Continued Relitigation of the 2020 Presidential Election - Dane County Executive Melissa Agard - Aug 29th, 2023
- Report Calls For Criminally Charging State’s Fake Electors - Henry Redman - Dec 19th, 2022
- Vos Withdraws Subpoenas, Ends Gableman Probe - Henry Redman - Aug 30th, 2022
- Judge Blasts Gableman Probe, Deleted Records - Henry Redman - Aug 17th, 2022
- Vos Fires Gableman, Ends Election Probe - Shawn Johnson - Aug 14th, 2022
- Judge Orders Gableman To Pay $163,000 In Legal Fees - Rich Kremer - Aug 2nd, 2022
- Prosecute 2020 Fake Electors, Advocates Demand - Erik Gunn - Aug 1st, 2022
Read more about 2020 General Election here