Biden or Trump Better for Economy?
Moody’s Analytics breaks it down. The difference is huge.
![The White House. Photo by AgnosticPreachersKid [CC BY-SA 3.0 (https://creativecommons.org/licenses/by-sa/3.0)]](https://urbanmilwaukee.com/wp-content/uploads/2019/07/White_House_DCj.jpg)
The White House. Photo by AgnosticPreachersKid (CC BY-SA 3.0)
Moody’s Analytics used its model of the US economy to project the effect of the economic proposals coming from both presidential candidates. The report’s authors note that Trump has been much vaguer in outlining his program than has Biden. This is surprising, or would be surprising if the president were anyone other than Trump. After almost four years in office, one would expect the incumbent’s policies to be better defined than the challenger’s.
The chart below summarizes the estimates used in the model for cumulative spending during the next four years, 2021 to 2024 in four broad areas: infrastructure, healthcare, the social safety net, and education.
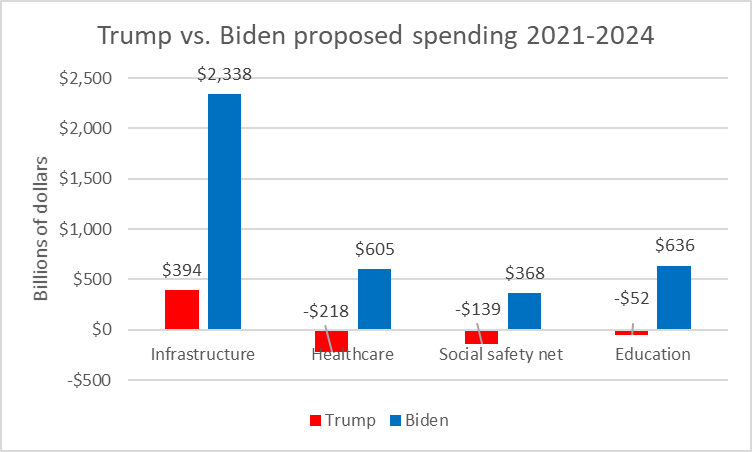
Trump vs. Biden proposed spending 2021-2024
One takeaway is obvious: Biden would be much more ambitious in using government spending to address society’s problems than would Trump. In fact, Trump proposes to reduce government spending in three of the four areas.
Taking spending over the next decade, 2021-2030, carries the same message: Biden is much more comfortable with an expanded public role than is Trump, or Trump’s economic advisers, given his well-known disinterest in public policy.
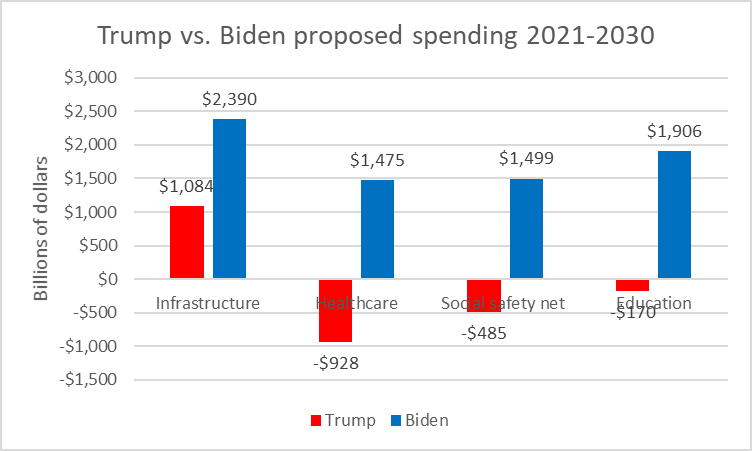
Trump vs. Biden proposed spending 2021-2030
The graph below shows the Biden spending proposals over ten years in more detail. The inner ring shows the four broad categories of spending (infrastructure, etc.) while the outer ring breaks each category into two to four programs (transportation, clean energy, etc.).
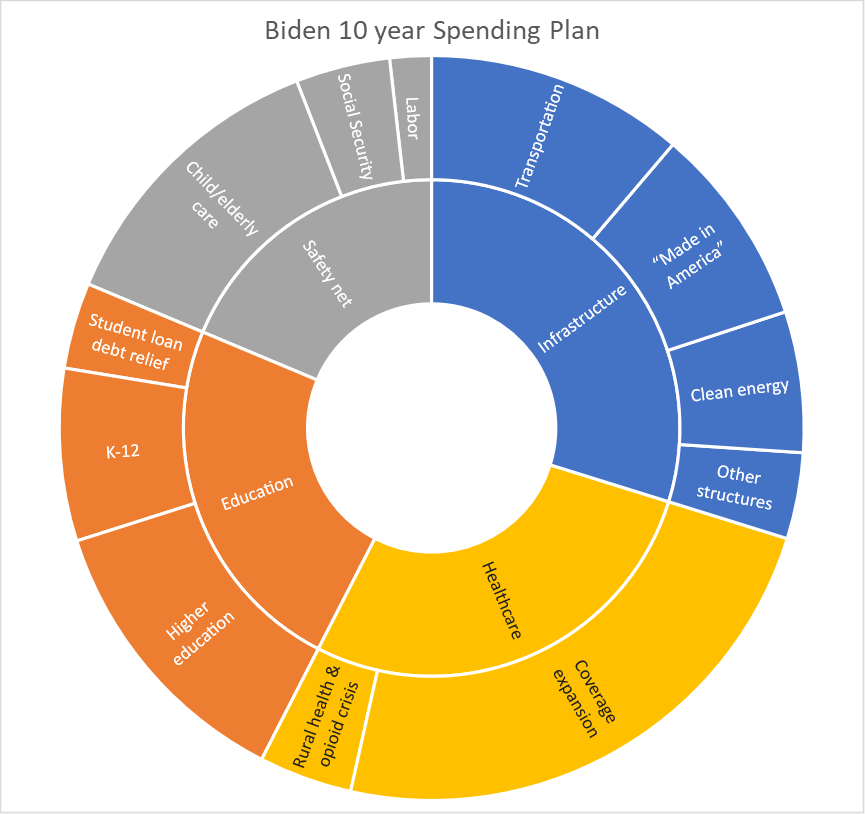
Biden 10 year Spending Plan
Shown below are Moody’s projections for real GDP (gross domestic product with inflation taken out) using two scenarios: “Republican sweep” assumes that Trump is reelected, Republicans keep their majority in the Senate and regain their control of the House. “Democratic sweep” assumes just the opposite: Biden is elected, and Democrats keep control of the House and gain control of the Senate. In other words, a Republican sweep means Trump’s proposals are adopted; a Democratic sweep means Biden’s are.
For the four-year term, 2021 to 2024, the model predicts that annual GDP growth would average 4.2% under the Biden proposals versus 3.1% under Trump’s. As a result, GDP would be $939 billion more in 2024 with a Democratic than a Republican sweep.
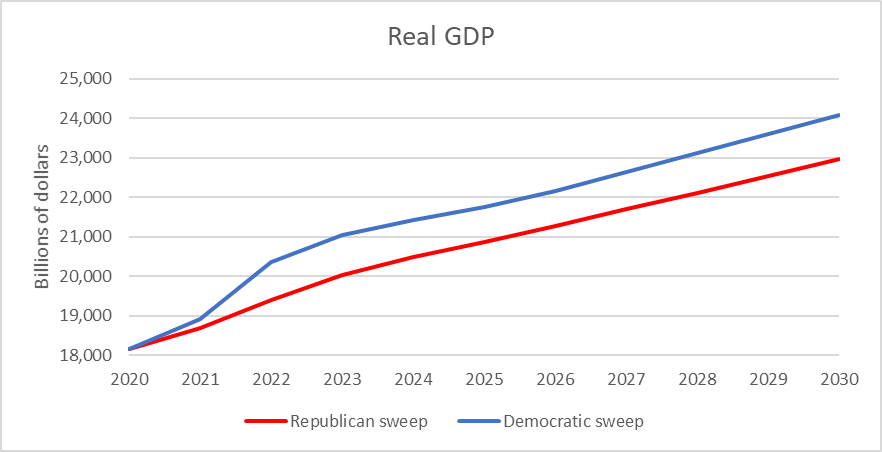
Real GDP
Similarly, projected total employment is higher under the Democratic sweep scenario, as shown in the next chart. Moody Analytics estimates the number of nonfarm jobs would grow by 16.5 million by 2024 under the Democratic sweep scenario compared to 9.3 million under the Republican sweep.
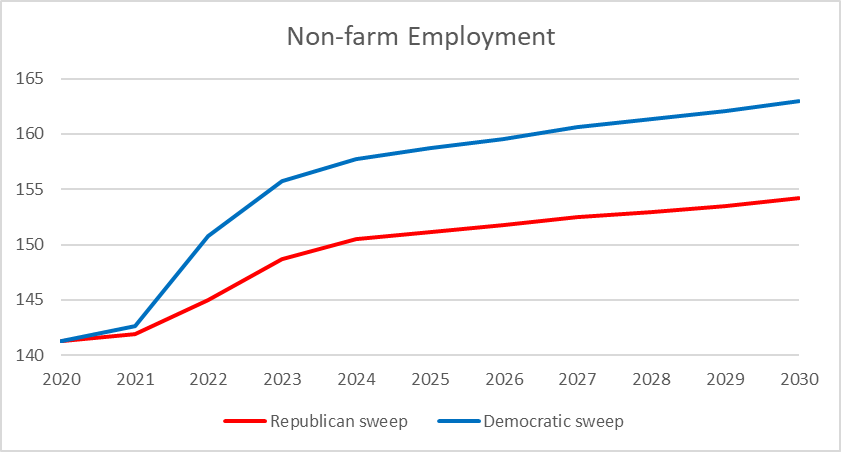
Non-farm Employment
By other measures as well, the Democratic sweep scenario generally results in a more vibrant economy, with lower unemployment, higher labor force participation, higher real income and higher corporate profits. It does result in a slightly higher federal debt—a debt to GDP ratio of 114.2 compared to 112.3 under the Republican sweep scenario.
Moody’s also considered two other scenarios. Both have the same legislative divide as today (Democratic House, Republican Senate) but in one Trump wins the presidency, in the other Biden wins. The economic effect of both these scenarios is much closer to the Republican sweep than the Democratic sweep. This seems unsurprising, since in divided government, it is easier not to do something than to take ambitious actions.
An article in the Washington Post, concludes that Moody’s Analytics isnot alone in finding a Biden win translating into brisker growth: Economists at Goldman Sachs and Oxford Economics conclude that even a version of Biden’s program that would have to shrink to pass the Senate would mean a faster rally back to prepandemic conditions.
Business Insider reported that Goldman’s chief economist said in a note that “a Biden-led blue wave would prompt an upgrade in growth forecasts.”
As part of his economic plan, Biden would undo portions of Trump’s Tax Cuts and Jobs Act (TCJA) that reduced taxes on high-income households. The chart below shows an analysis from the conservative American Enterprise Institute of the impact of Biden’s tax plan on people with various income levels broken down by decile. The highest decile is further broken in three parts—the top 1%, the next 4%, and the next 5 percent.
In contrast to the TCJA, Biden’s plan would make the tax system far more progressive. Most of the new revenue would come from corporations or extremely wealthy people. True to form, at the final debate, Trump claimed that Biden “wants to raise everybody’s taxes.” As the next chart shows, his statement is true only if “everybody” is redefined to encompass just those making more than $400,000. More than 90% of Americans would see their after-tax income rise.
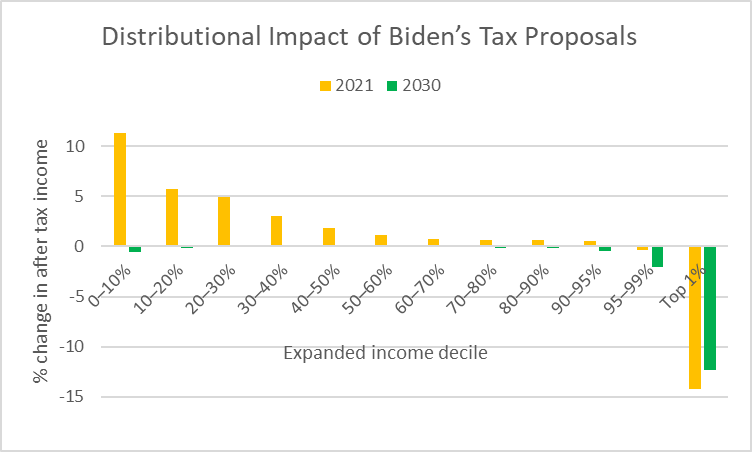
Distributional Impact of Biden’s Tax Proposals
Trump’s decision to let the coronavirus rip through the US is a strange one. His refusal to recognize the need for a fiscal stimulus is stranger still.
A common element in both cases is Biden’s comfort with expertise. In contrast, in Trump’s Washington any experts willing to tell the president the truth are unlikely to last long.
More about the 2020 General Election
- FBI Knocks, Milwaukee Answers With Two New Law Firms On Its Side - Jeramey Jannene - Jun 2nd, 2026
- FBI Wants to Interview Milwaukee Police Officers Related to 2020 Election - Jeramey Jannene - May 21st, 2026
- MKE County: FBI Visits Milwaukee County Elections Director - Graham Kilmer - May 14th, 2026
- Senator Agard Statement on Senator Knodl’s Continued Relitigation of the 2020 Presidential Election - Dane County Executive Melissa Agard - Aug 29th, 2023
- Report Calls For Criminally Charging State’s Fake Electors - Henry Redman - Dec 19th, 2022
- Vos Withdraws Subpoenas, Ends Gableman Probe - Henry Redman - Aug 30th, 2022
- Judge Blasts Gableman Probe, Deleted Records - Henry Redman - Aug 17th, 2022
- Vos Fires Gableman, Ends Election Probe - Shawn Johnson - Aug 14th, 2022
- Judge Orders Gableman To Pay $163,000 In Legal Fees - Rich Kremer - Aug 2nd, 2022
- Prosecute 2020 Fake Electors, Advocates Demand - Erik Gunn - Aug 1st, 2022
Read more about 2020 General Election here