Has Trump Been Good for the Economy?
What people believe about the economy and what the data shows.
Donald Trump. Photo from whitehouse.gov.
One of the questions asked of Wisconsin voters by the Marquette Law School poll this August was whether they approved or disapproved of the way Donald Trump is handling the economy. The poll has asked this question every time it has gone to the field for the past year, as shown in the chart below. Except for the August 2019 survey, more people approved Trump’s handling of the economy (shown in red) than disapproved (in blue). The pandemic has caused some narrowing of the net approval rating, but even so, more approve than disapprove of Trump’s handling of the economy.
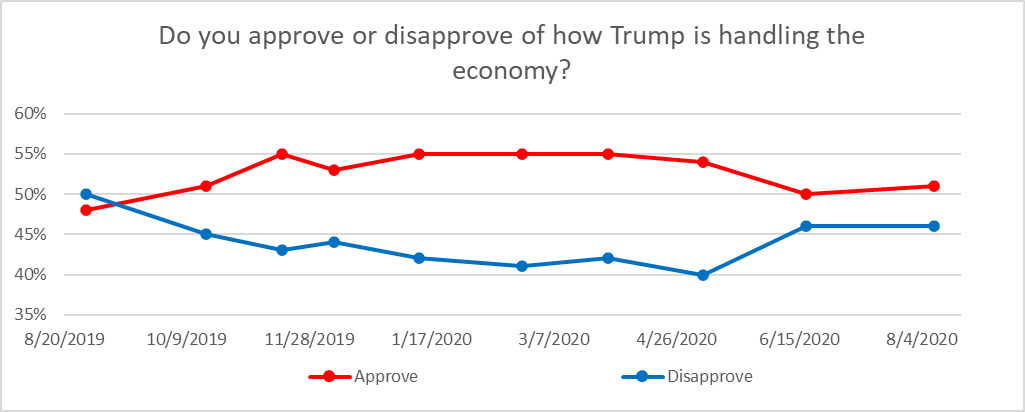
Do you approve or disapprove of how Trump is handling the economy?
The last two polls have also asked about approval of Trump’s handling of the “black lives matter” protests. In this case, the results are strongly negative. In the most recent poll, 32 percent of the respondents approved of Trump’s handling of protests compared to 58 percent who disapproved. The poll has asked about Trump’s handling of the coronavirus, and in late March when the question was first asked, approvals slightly outnumbered disapprovals. That probably reflected Trump’s apparent switch from denying the seriousness of the pandemic to listening to experts’ warning. Over time, as Trump pressed for reopenings, sentiment turned sharply negative. Most recently, 40 percent approved Trump’s handling of the virus, compared to 57 percent who disapproved.
Wisconsin is not unique. Taken after both conventions, the Grinnell College/Selzer poll of voters nationwide came to very similar results, as shown in the graph below. Again, approvals are shown in red, disapprovals in blue. As with Wisconsinites, more voters disapproved of Trump’s job on every issue questioned—except when it comes to the economy.
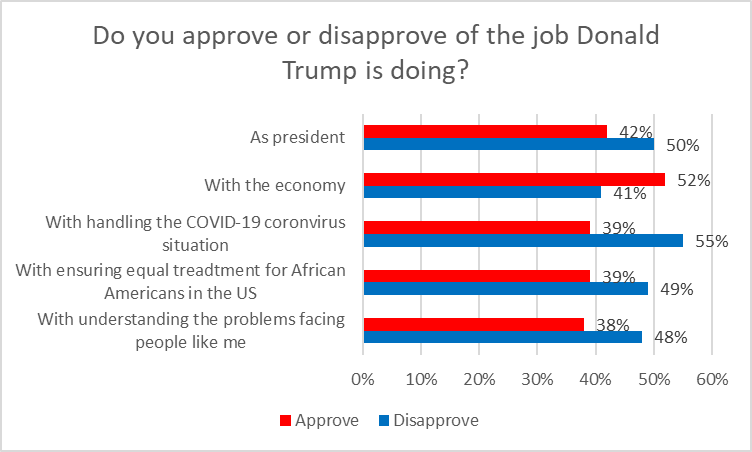
Do you approve of disapprove of the job Donald Trump is doing?
Another question the Marquette poll has asked repeatedly over time is, “Over the past year, do you feel the economy has gotten better, gotten worse, or stayed about the same?” The chart below shows the breakdown of the responses since it was first asked in 2012. During the first half of the period, responses were quite consistent. Those saying better and worse both represented around thirty percent each while those saying the economy had stayed the same were at 40 percent or a bit more.
The chart shows two abrupt shifts in sentiment. The second, with the advent of 2020 is easy to explain: the coronavirus hit, and the US did not have a consistent response. In reality, the economy became much worse.The earlier shift in sentiment is more mysterious. Between the end of 2016 and the start of 2017 there was a dramatic shift in sentiment. The number of respondents saying the economy got better surged, with a corresponding collapse in the number claiming the economy got worse. What happened?
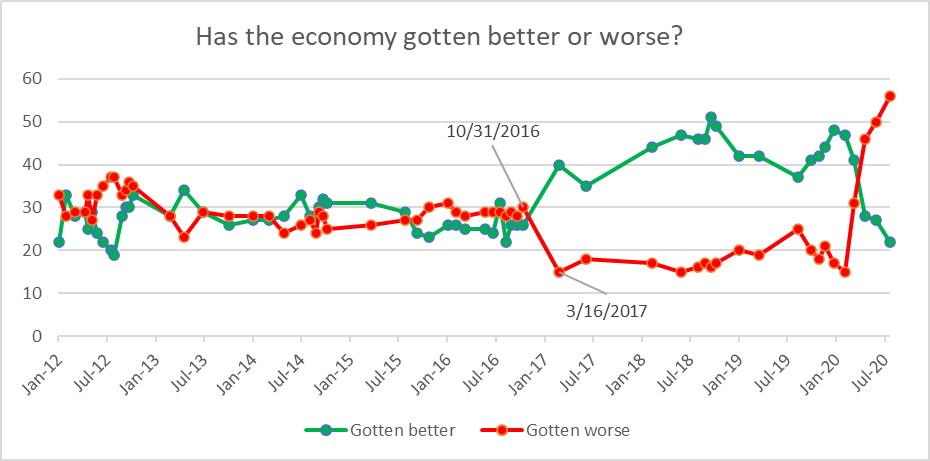
Has the economy gotten better or worse?
The next chart shows the answer. With the election of Donald Trump, Republicans saw what they wanted to. Between October and the following March, the percentage of Republicans saying the economy had gotten better surged from 14 percent to 59 percent while those saying it was worse dropped from 42 percent to 5 percent.
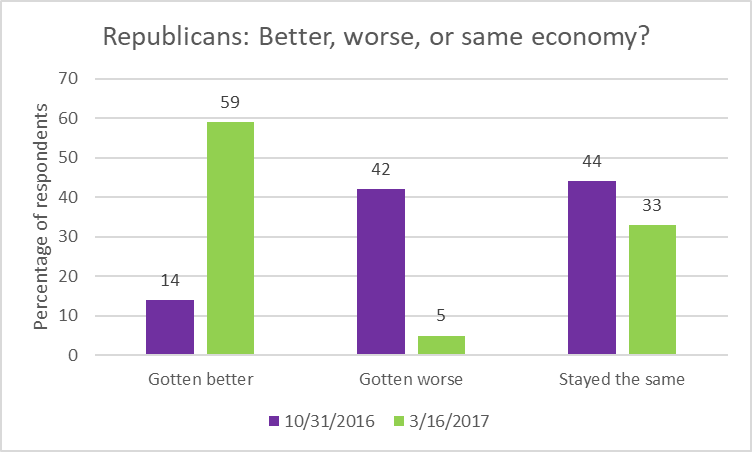
Republicans: Better, worse, or same economy?
Was the Wisconsin Republicans’ increased optimism borne out by the economy’s subsequent performance? Let’s start with data on the gross domestic product (GDP) before and after Trump took over. The next chart shows the percentage change in GDP for each quarter between 2007 and 2020. This time period is bracketed by two recessions, the Great Recession on the left and the pandemic on the right. In between is steady, if slow, economic growth under both Obama and Trump. (As is common practice, the numbers shown are for a full year assuming that all four quarters grew at the same rate.) That steady growth ended after the pandemic hit and there was a drastic decline in the GDP, the worst seen since the Great Depression of the 1930s.
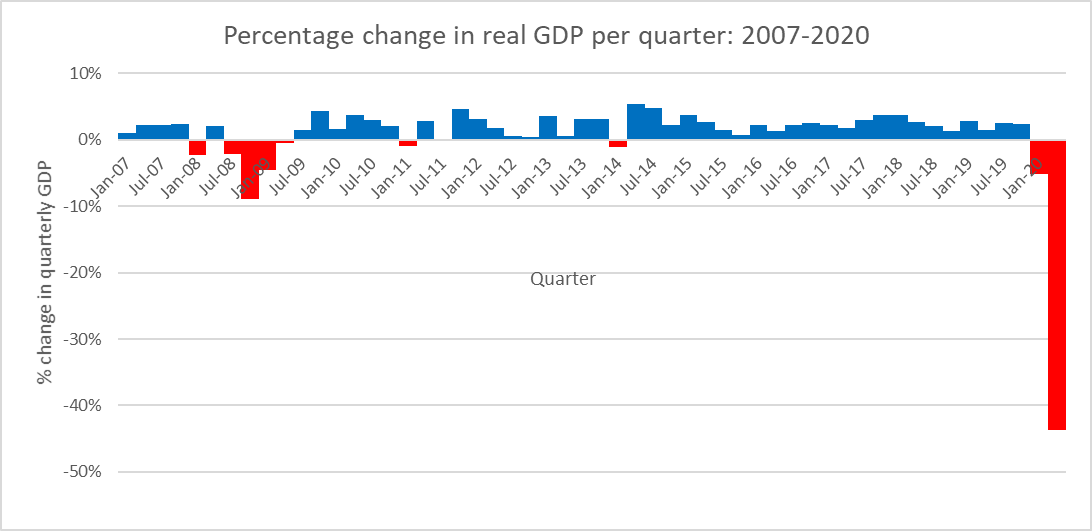
Percentage change in real GDP per quarter: 2007-2020
A similar tale is told by the job numbers. The next graph shows job growth following the four most recent previous recessions. The recovery in the 1980’s and generally associated with Reagan (in blue), the recovery that started in the GHW Bush administration and extended through the Clinton administration (in red), the mini-recovery during the GW Bush administration (in green), cut short by the Great Recession, and the Great Recession itself (in black). In each of these, point zero is the month when jobs hit bottom.

% Growth in US Jobs in 4 Most Recent Recoveries
Compared to either the 1980s or the 1990s recoveries, the recent recovery is both slower and lasts longer. In fact, the Trump part of the recovery looks very much like an extension of the Obama part. On the graph above, I placed two vertical lines. The black dashed line shows when Trump took office. The dotted line shows when the Tax Cuts Act took effect. It appears that the nation’s economy took no notice of these events, contrary to the expectations of the Wisconsin Republican voters who responded to the Marquette polls. And then came the pandemic, which led to a massive downtown in jobs (represented at the end of the black line) followed by a partial recovery that still leaves jobs way below the level achieved under Barack Obama.
This conclusion tends to support the predominant view of the economics profession—that people tend to exaggerate the economic effect of whoever is president, or, for that matter, governor. For example, voters in states dependent on oil tend to credit the governor when oil prices are high and blame the governor when prices are low, even though prices are determined by the world market over which the governor has little control.
In the last three years of the Obama administration, GDP growth averaged 2.37 percent compared to 2.51 percent in the first three years of Trump. By contrast, in the last three years of Obama jobs grew 5.7 percent, compared to 4.4 percent in the first three years of Trump.Under normal circumstances, the Federal Reserve, by controlling the money supply, probably has more day-to-day control over the American economy than does the president. Under extraordinary circumstances, however, the effectiveness of the president can make all the difference.
When it comes to affecting the economy, presidents’ most powerful tool is probably fiscal policy, such as the Obama administration’s stimulus package used to fight the Great Recession. Further stimulus became impossible, however, once Senate Democrats lost their 60-vote majority with the death of Senator Ted Kennedy.
As a result, economic recovery continued throughout the remainder of the Obama administration and through the first three years of the Trump administration, but far more weakly than previous recoveries. Finally, this recovery was dramatically reversed by the pandemic and the incompetent response of the Trump administration.
So, the answer to the question posed at the beginning of this column — Has Trump been good for the US economy? — is two-fold. If the query is limited to the period before 2020, the economy did about as well under Trump as it was on track to do under Obama, given the constraints on Obama from a hostile Congress. If, however, the time period under consideration is extended to today, the Trump administration must be considered an economic disaster.
Data Wonk
-
Who Do You Trust to Conduct Elections Fairly?
 Apr 6th, 2026 by Bruce Thompson
-
Is Non-Citizen Voting a Real Threat to Elections in Wisconsin?
Mar 18th, 2026 by Bruce Thompson
-
How Global Climate Change Affects Milwaukee
 Mar 11th, 2026 by Bruce Thompson