
COVID-19 Spread Accelerating in Wisconsin
Number of new cases in past 24 hours at highest level in 28 days.

COVID-19. Credit: U.S. Army.
The growth rate in the number of people confirmed to have COVID-19 in Wisconsin is accelerating.
The state Department of Health Services reported 520 newly-confirmed cases on Friday, the largest single-day total since May 30th. The total came from 9,127 tests processed, a positive case rate of 5.70 percent, the highest since May 27th.
The seven-day positive case rate now stands at 3.99 percent, with the 14-day positive rate at 3.51 percent. Both rates have climbed since June 19th. The seven-day figure now exceeds all values reported since June 3rd, the 14-day figure is still below the most recent high of 3.30 percent recorded on June 9th.
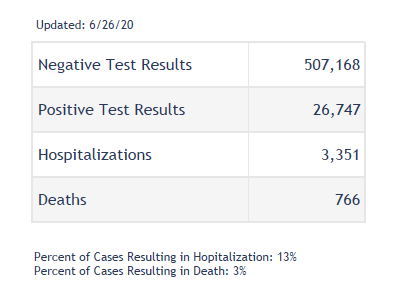
The number of people actively hospitalized increased to 262 and has now grown by 21 over the past week, but is still near a low last seen in the first days of April. A total of 25 people were newly admitted for hospitalization in the past 24 hours, below the 30-day average of 31.The death toll from the disease stands at 766, with no new deaths confirmed in the past day.
A total of 26,747 people have been confirmed to have COVID-19 in Wisconsin. DHS reports that 79 percent of individuals with a confirmed case have “recovered,” as defined by a documented abatement of symptoms or a diagnosis over 30 days ago.
According to DHS data, 1,133.1 out of every 100,000 Milwaukee County residents have tested positive for COVID-19 (up from 1,118.6) since the outbreak began. Racine County has 1,097.2 cases per 100,000 residents (up from 1,087). Brown County, which is anchored by Green Bay, has 1,053.9 cases per 100,000 residents (up from 1,038.5).
Kenosha (861.4), Walworth (542.6), Rock (511.2), Dodge (509.3), Forest (421.4), Lafayette (394.4), Winnebago (376), Trempealeau (360.1) and La Crosse (314.8) are the only other counties with more than 300 cases per 100,000 residents.
The statewide average of cases per 100,000 residents rose to 462.9 (up from 453.9).
There are currently 953 ventilators and 343 intensive care unit (ICU) beds available across the state according to the Wisconsin Hospital Association. Since the data became publicly available on April 10th, WHA has reported an average of 941 ventilators and 398 ICU beds as available.
Charts and Maps


Wisconsin COVID-19 summary by person
Data from DHS.
Percent of COVID-19 cases by hospitalization status
| Hospitalization status | Number of confirmed cases as of 6/26/2020 | Percent of confirmed cases as of 6/26/2020 |
|---|---|---|
| Ever hospitalized | 3,351 | 13% |
| Never hospitalized | 15,681 | 59% |
| Unknown | 7,715 | 29% |
| Total | 26,747 | 100% |
Summary of COVID-19 cases by age group
| Age Group (Years) | Cases as of 6/26/2020 | Ever hospitalized as of 6/26/2020 | Any Intensive Care as of 6/26/2020 | Deaths as of 6/26/2020 |
|---|---|---|---|---|
| <10 | 875 | 25 | 2 | 0 |
| 10-19 | 2,015 | 51 | 3 | 0 |
| 20-29 | 5,740 | 186 | 26 | 8 |
| 30-39 | 4,750 | 271 | 37 | 8 |
| 40-49 | 4,218 | 404 | 91 | 23 |
| 50-59 | 3,823 | 562 | 130 | 58 |
| 60-69 | 2,594 | 696 | 204 | 127 |
| 70-79 | 1,388 | 592 | 146 | 200 |
| 80-89 | 892 | 410 | 74 | 190 |
| 90+ | 452 | 154 | 28 | 152 |
| Total | 26,747 | 3,351 | 741 | 766 |
Number of positive cases and deaths by county
| Wisconsin County | Positive as of 6/26/2020 | Negative as of 6/26/2020 | Deaths as of 6/26/2020 | Rate (positive cases per 100,000 people) as of 6/26/2020 | Case fatality percentage (percent of cases who died) as of 6/26/2020 |
|---|---|---|---|---|---|
| Adams | 14 | 1,397 | 2 | 69.7 | 14% |
| Ashland | 3 | 720 | 0 | 19.1 | 0% |
| Barron | 32 | 3,471 | 0 | 70.7 | 0% |
| Bayfield | 3 | 1,035 | 1 | 20.0 | 33% |
| Brown | 2,738 | 30,396 | 41 | 1053.9 | 1% |
| Buffalo | 7 | 937 | 2 | 53.2 | 29% |
| Burnett | 2 | 808 | 1 | 13.1 | 50% |
| Calumet | 96 | 3,179 | 2 | 192.7 | 2% |
| Chippewa | 78 | 4,584 | 0 | 122.6 | 0% |
| Clark | 67 | 2,003 | 6 | 194.3 | 9% |
| Columbia | 76 | 4,868 | 1 | 133.4 | 1% |
| Crawford | 32 | 2,298 | 0 | 196.5 | 0% |
| Dane | 1,446 | 59,681 | 32 | 272.9 | 2% |
| Dodge | 447 | 9,635 | 5 | 509.3 | 1% |
| Door | 43 | 2,655 | 3 | 156.7 | 7% |
| Douglas | 22 | 2,124 | 0 | 50.7 | 0% |
| Dunn | 34 | 3,311 | 0 | 76.4 | 0% |
| Eau Claire | 180 | 7,673 | 1 | 174.8 | 1% |
| Florence | 3 | 370 | 0 | 69.2 | 0% |
| Fond du Lac | 306 | 9,169 | 6 | 299.1 | 2% |
| Forest | 38 | 511 | 3 | 421.4 | 8% |
| Grant | 141 | 5,096 | 12 | 272.1 | 9% |
| Green | 84 | 2,748 | 1 | 227.9 | 1% |
| Green Lake | 29 | 1,604 | 0 | 154.6 | 0% |
| Iowa | 27 | 2,167 | 0 | 114.3 | 0% |
| Iron | 3 | 347 | 1 | 52.5 | 33% |
| Jackson | 26 | 2,303 | 1 | 126.8 | 4% |
| Jefferson | 211 | 6,186 | 4 | 249.3 | 2% |
| Juneau | 31 | 2,390 | 1 | 117.3 | 3% |
| Kenosha | 1,450 | 16,175 | 41 | 861.4 | 3% |
| Kewaunee | 52 | 1,403 | 1 | 255.4 | 2% |
| La Crosse | 371 | 10,787 | 0 | 314.8 | 0% |
| Lafayette | 66 | 1,231 | 0 | 394.4 | 0% |
| Langlade | 7 | 1,260 | 0 | 36.5 | 0% |
| Lincoln | 9 | 1,493 | 0 | 32.3 | 0% |
| Manitowoc | 83 | 5,743 | 1 | 104.5 | 1% |
| Marathon | 140 | 6,270 | 1 | 103.5 | 1% |
| Marinette | 49 | 4,117 | 3 | 120.9 | 6% |
| Marquette | 12 | 1,024 | 1 | 78.9 | 8% |
| Menominee | 5 | 1,087 | 0 | 109.2 | 0% |
| Milwaukee | 10,812 | 99,247 | 382 | 1133.1 | 4% |
| Monroe | 59 | 4,299 | 1 | 129.7 | 2% |
| Oconto | 52 | 3,150 | 0 | 138.5 | 0% |
| Oneida | 18 | 2,180 | 0 | 50.9 | 0% |
| Outagamie | 436 | 14,151 | 8 | 236.0 | 2% |
| Ozaukee | 214 | 6,113 | 15 | 242.4 | 7% |
| Pepin | 1 | 527 | 0 | 13.8 | 0% |
| Pierce | 64 | 2,482 | 0 | 153.8 | 0% |
| Polk | 43 | 3,298 | 1 | 99.2 | 2% |
| Portage | 117 | 5,047 | 0 | 165.7 | 0% |
| Price | 2 | 884 | 0 | 14.8 | 0% |
| Racine | 2,144 | 24,143 | 61 | 1097.2 | 3% |
| Richland | 15 | 1,427 | 4 | 85.5 | 27% |
| Rock | 827 | 14,506 | 23 | 511.2 | 3% |
| Rusk | 11 | 716 | 0 | 77.6 | 0% |
| Sauk | 98 | 6,329 | 3 | 154.1 | 3% |
| Sawyer | 12 | 1,723 | 0 | 73.3 | 0% |
| Shawano | 74 | 3,552 | 0 | 180.4 | 0% |
| Sheboygan | 190 | 8,014 | 4 | 164.9 | 2% |
| St. Croix | 150 | 5,609 | 1 | 170.6 | 1% |
| Taylor | 10 | 942 | 0 | 49.1 | 0% |
| Trempealeau | 106 | 3,207 | 0 | 360.1 | 0% |
| Vernon | 32 | 2,248 | 0 | 104.9 | 0% |
| Vilas | 10 | 1,069 | 0 | 46.3 | 0% |
| Walworth | 559 | 8,141 | 18 | 542.6 | 3% |
| Washburn | 4 | 1,080 | 0 | 25.5 | 0% |
| Washington | 337 | 8,332 | 15 | 250.5 | 4% |
| Waukesha | 1,085 | 22,375 | 38 | 272.0 | 4% |
| Waupaca | 104 | 4,664 | 6 | 202.2 | 6% |
| Waushara | 20 | 2,523 | 0 | 82.9 | 0% |
| Winnebago | 639 | 16,309 | 11 | 376.0 | 2% |
| Wood | 39 | 4,625 | 1 | 53.2 | 3% |
| Total | 26,747 | 507,168 | 766 | 462.9 | 3% |
If you think stories like this are important, become a member of Urban Milwaukee and help support real, independent journalism. Plus you get some cool added benefits.
More about the Coronavirus Pandemic
- Governors Tony Evers, JB Pritzker, Tim Walz, and Gretchen Whitmer Issue a Joint Statement Concerning Reports that Donald Trump Gave Russian Dictator Putin American COVID-19 Supplies - Gov. Tony Evers - Oct 11th, 2024
- MHD Release: Milwaukee Health Department Launches COVID-19 Wastewater Testing Dashboard - City of Milwaukee Health Department - Jan 23rd, 2024
- Milwaukee County Announces New Policies Related to COVID-19 Pandemic - David Crowley - May 9th, 2023
- DHS Details End of Emergency COVID-19 Response - Wisconsin Department of Health Services - Apr 26th, 2023
- Milwaukee Health Department Announces Upcoming Changes to COVID-19 Services - City of Milwaukee Health Department - Mar 17th, 2023
- Fitzgerald Applauds Passage of COVID-19 Origin Act - U.S. Rep. Scott Fitzgerald - Mar 10th, 2023
- DHS Expands Free COVID-19 Testing Program - Wisconsin Department of Health Services - Feb 10th, 2023
- MKE County: COVID-19 Hospitalizations Rising - Graham Kilmer - Jan 16th, 2023
- Not Enough Getting Bivalent Booster Shots, State Health Officials Warn - Gaby Vinick - Dec 26th, 2022
- Nearly All Wisconsinites Age 6 Months and Older Now Eligible for Updated COVID-19 Vaccine - Wisconsin Department of Health Services - Dec 15th, 2022
Read more about Coronavirus Pandemic here


Good morning Jeramey As I read and listen to the daily reports on COVID I ponder how to get information that would be more useful to folks who are trying to figure out how vulnerable they are and may make more sense to those who are not following the recommendations. First we know that it takes an infected person to come in contact with another to transmit the virus. No infected person no transmission. So how many folks are contagious seems to the the primary question and where are they with as much specifics as possible. We know that how many will be from today and then add the previous 2 to 4 days. Then there is the estimate of how many have no symptoms (that is another whole issue to deal with). That will get us the total umber of folks that can pass on the virus. Now how many are in quarantine ie they are known. Then that leaves us with the spreaders and then what is the rate of the spread 1 to 1 1 to 2 Bad or 1 to .5 Good Again where are they and if the numbers are low a county basis works but if the numbers are in the 100’s then by census tract or better is more useful. Some more work but once the data begins to flow so it is more useful it will not be any more work. Just morning thoughts Thanks for all that you are doing