
Is Less Testing for COVID-19 the Answer?
Trump says the rise in cases is due to more testing. What does the data show?

Wisconsin National Guard individuals man a COVID-19 testing facility in Bay View. Photo by Jeramey Jannene.
At his Tulsa rally, President Donald Trump said, “You know testing is a double-edged sword. Here’s the bad part … when you do testing to that extent, you’re going to find more people; you’re going to find more cases. So, I said to my people, ‘Slow the testing down please.’”
While his campaign claimed that the president was jesting, Trump insisted he was serious, and his comment does raise a serious issue: is the increasing number of Cobid-19 cases in states like Oklahoma, North Carolina, and Florida something that is real or is it simply a side-effect of more testing? The chart below updates one in my last week’s column. Note that in all three states, there has been a substantial jump in the number of reported cases.

COVID-19 Cases per 100,000 population (Oklahoma, North Carolina, and Florida)
To make the results from each state comparable to each other, the case counts were divided by the states’ population to arrive at the number of reported cases per 100,000 population. Also, to smooth out the lines, the data shown are 7-day moving averages around the day itself. For comparison, I also included the Wisconsin cases.
I picked these three states because they were ones to which Trump hoped to bring a crowd as part of his reelection campaign this summer. Oklahoma was included for his rally in Tulsa this past weekend, North Carolina and Florida because they were each scheduled to play parts in the Republican National Convention.
Both President Trump and Vice President Mike Pence have been spreading the word that the apparent increase in COVID-19 is due entirely to more testing.The very pro-Trump Federalist magazine takes it one step further. A current article explains that it is all a conspiracy by the liberal media to make Trump look bad.
Do the case count increases reflect increased infections? Or do they just result from increased testing? Unfortunately, much of the COVID-19 data is in a bit of a mess. In some instances, it appears that rules changed midstream, so suddenly numbers jump up or, more rarely, down. In the following discussion, I try to work around obvious errors.
One indication that an increase in cases reflects an increase in infection is supplied by increasing hospitalizations. For example, here are the new hospitalizations reported by Oklahoma. In the last couple of weeks, there is a distinct increase. (The earlier spike does fit with the early April peak in cases, as well.)

New Hospitalizations in Oklahoma
In North Carolina, the number of hospital patients with COVID-19 has been steadily rising, as shown below. Note that North Carolina chose a different measure than did Oklahoma, so that a hospital patient is counted for every day in the hospital. The Oklahoma patient is counted once, upon entering the hospital.
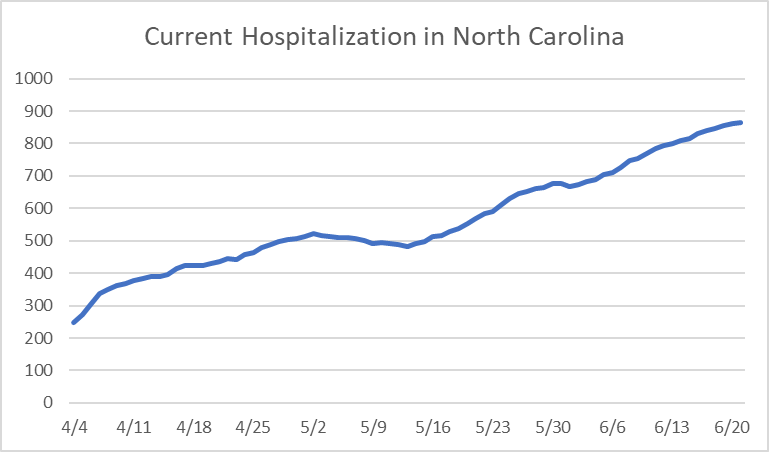
Current Hospitalization in North Carolina
In Florida, hospitalizations are essentially flat, mostly ranging between 100 and 200 per day. However, other data suggest that the June Florida case increase is real. The next plot shows Florida’s reported tests per 100,000 residents. Note that they peak in early May and then drop off. Yet the case number does not start its climb until early June.
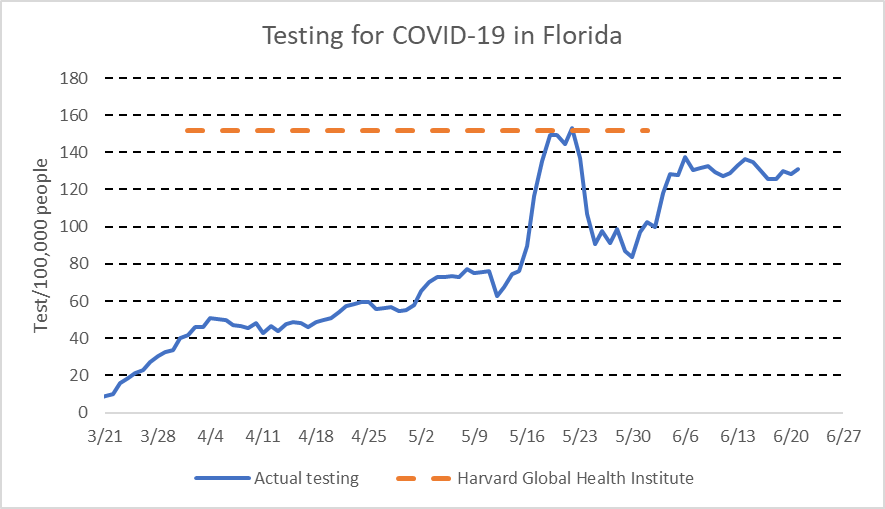
Testing for COVID-19 in Florida
More disturbingly, if real infections were constant one would expect the proportion of positive tests would decline as testing increased, as testing was open to all rather than only people with symptoms. As the next graph shows, that is exactly what happened in April and most of May. Yet, the percentage of positive tests increased shot up in June, going from 2 percent to 12 percent. More infections were found because more infections were waiting to be found.
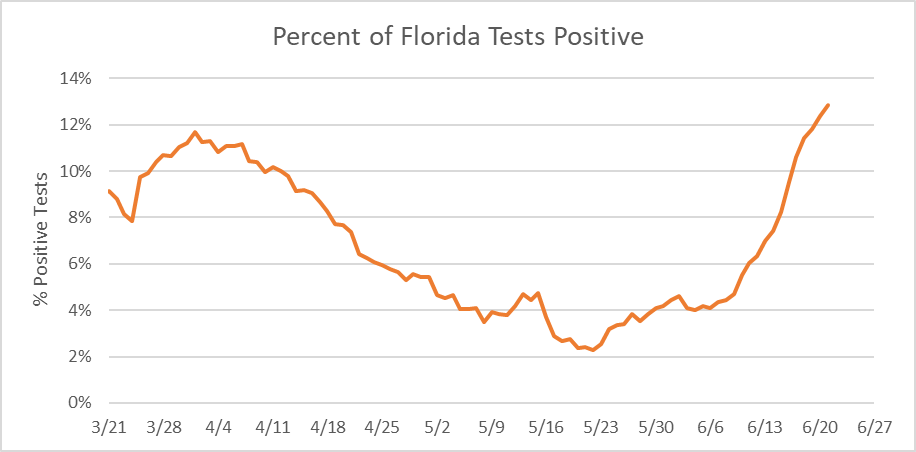
Percent of Florida Tests Positive
As the next chart shows, North Carolina has also stepped up its testing. Without an increase in infections, this would be expected to result in an increase in negative findings.
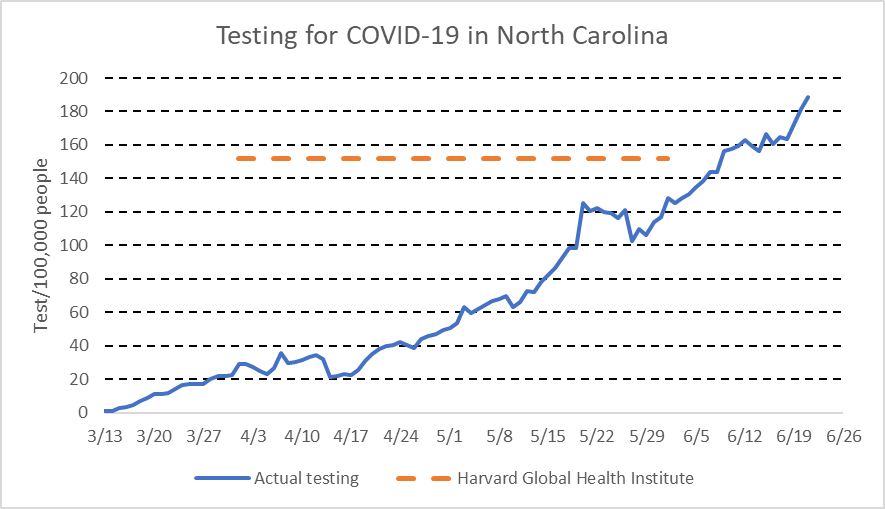
Testing for COVID-19 in North Carolina
Yet this expectation is false. As the next chart shows, the percentage of positive tests has remained around 7 percent for some time.
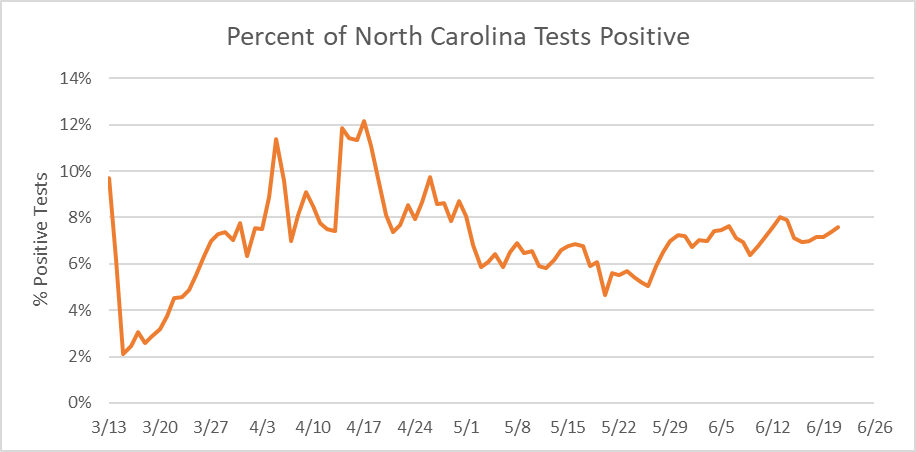
Percent of North Carolina Tests Positive
As the next two charts show, Oklahoma tells much the same story. Increased testing in the first chart:
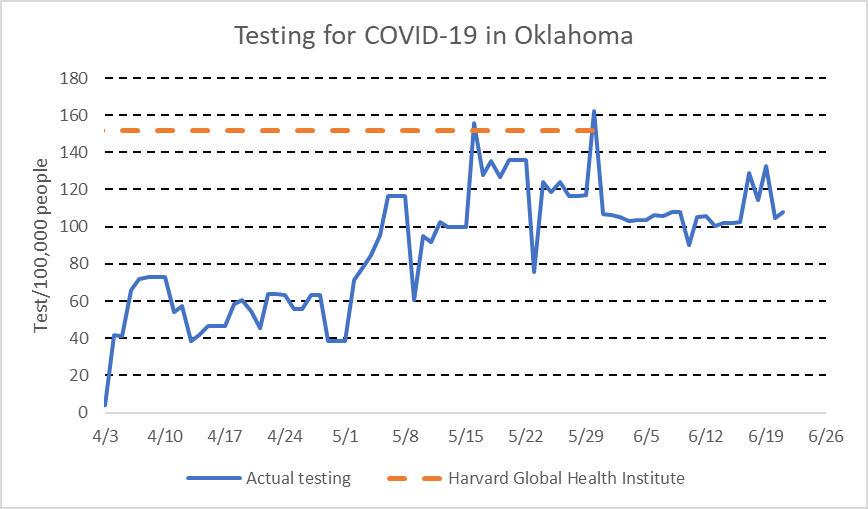
Testing for COVID-19 in Oklahoma
Accompanied by an increasing percentage of positive results:
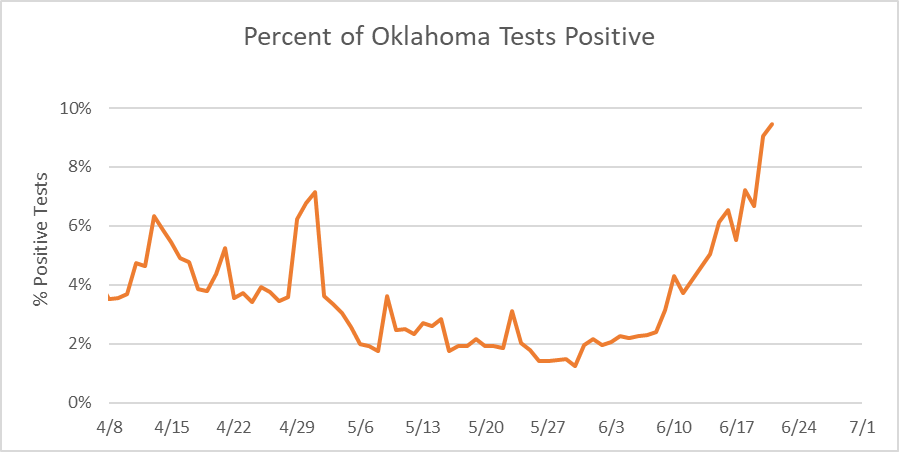
Percent of Oklahoma Test Positive
Oklahoma, North Carolina, and Florida are not unique. Arizona, Georgia, Nevada, and Texas are others that are seeing a strong case growth in June. Part of the problem may be that these states fared fairly well early in the pandemic, which made them overly confident about their ability to survive COVID-19. They may have regarded social distancing as a burden they carried to benefit other people, particularly those in hard-hit areas of the Northeast. As a result, it is increasingly evident they reopened too early.
In addition, these states were carried by Trump in 2016, who is likely to still have substantial influence on behavior, ranging from whether to wear a mask to how seriously the threat from the virus remains.
This brings us to the question of what lies ahead for Milwaukee and Wisconsin. Wisconsin has succeeded in bringing down both the rate of infections (to a little over 300 per day) and deaths (around 8 per day), as the next chart shows. But the state has lost a bit of ground in the last week or so. Hopefully, this is just a blip and we will become more expert in separating physically while going about our business.
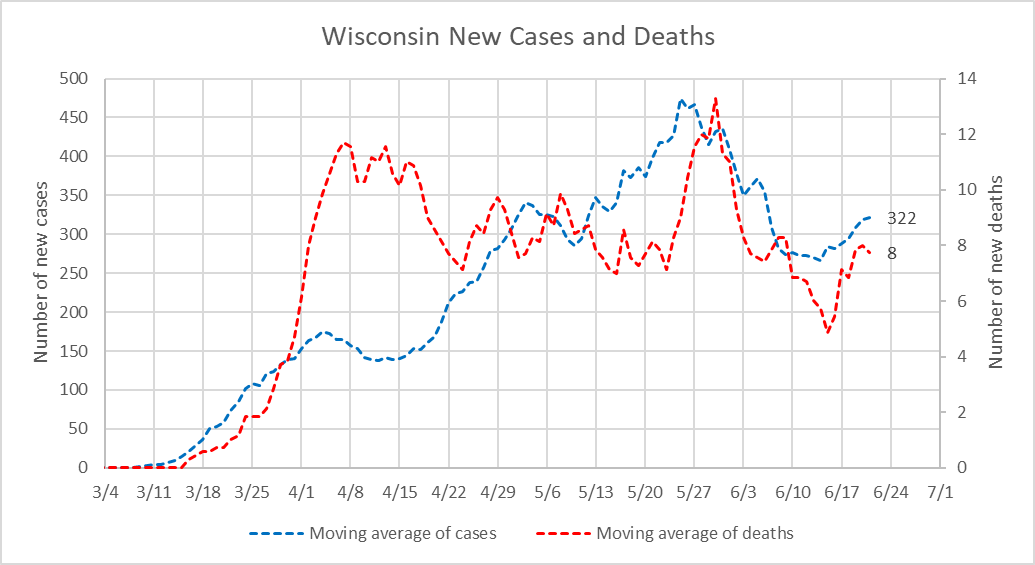
Wisconsin New Cases and Deaths
Epidemiologists refer to Rt values as a measure of how fast a virus is spreading. It gives the number of people on average who become infected by an infectious person. If Rt is above 1.0, the virus will spread and the higher the value the more quickly. If below 1.0, the virus will shrink.
The chart below shows the Rt values over time for Wisconsin calculated by one model. Notice that for much of April and May the value was slightly negative, suggesting that infection rates were on track to gradually decline. In June, Rt became slightly positive, implying that infections will grow, if nothing else changes.

Rt Results for Wisconsin
The effect of the protests on the pandemic is still a concern; hopefully the widespread use of masks, the fact that demonstrations were held outdoors, and the youthfulness of many of the protestors will keep the virus from spreading.
Another concern is that the state Supreme Court’s ruling essentially gutting the provisions in state law allowing the state health department to issue shutdown orders in the event of a health emergency will leave Wisconsin with few effective tools if the pandemic returns in force. COVID-19 is still out there, waiting for an opportunity.
More about the Coronavirus Pandemic
- Governors Tony Evers, JB Pritzker, Tim Walz, and Gretchen Whitmer Issue a Joint Statement Concerning Reports that Donald Trump Gave Russian Dictator Putin American COVID-19 Supplies - Gov. Tony Evers - Oct 11th, 2024
- MHD Release: Milwaukee Health Department Launches COVID-19 Wastewater Testing Dashboard - City of Milwaukee Health Department - Jan 23rd, 2024
- Milwaukee County Announces New Policies Related to COVID-19 Pandemic - David Crowley - May 9th, 2023
- DHS Details End of Emergency COVID-19 Response - Wisconsin Department of Health Services - Apr 26th, 2023
- Milwaukee Health Department Announces Upcoming Changes to COVID-19 Services - City of Milwaukee Health Department - Mar 17th, 2023
- Fitzgerald Applauds Passage of COVID-19 Origin Act - U.S. Rep. Scott Fitzgerald - Mar 10th, 2023
- DHS Expands Free COVID-19 Testing Program - Wisconsin Department of Health Services - Feb 10th, 2023
- MKE County: COVID-19 Hospitalizations Rising - Graham Kilmer - Jan 16th, 2023
- Not Enough Getting Bivalent Booster Shots, State Health Officials Warn - Gaby Vinick - Dec 26th, 2022
- Nearly All Wisconsinites Age 6 Months and Older Now Eligible for Updated COVID-19 Vaccine - Wisconsin Department of Health Services - Dec 15th, 2022
Read more about Coronavirus Pandemic here
Data Wonk
-
Who Do You Trust to Conduct Elections Fairly?
 Apr 6th, 2026 by Bruce Thompson
-
Is Non-Citizen Voting a Real Threat to Elections in Wisconsin?
Mar 18th, 2026 by Bruce Thompson
-
How Global Climate Change Affects Milwaukee
 Mar 11th, 2026 by Bruce Thompson


As usual, Bruce provides us with a lot of data, as well as thoughtful analysis and explanations of what is happening!