Five of Six Badger Bounce Back Critieria Have Green Light
Testing totals should soon surge as a result of Wisconsin National Guard collections.
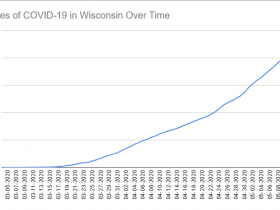
The number of people testing positive for COVID-19 in Wisconsin held steady over the past 24 hours, while the number of tests processed increased by almost 2,000.
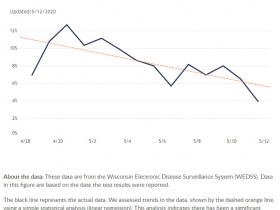
In total, 4,908 tests were processed yesterday with 193 coming back positive (3.93 percent) according to the state Department of Health Services. The percentage is the lowest reported since the state first reported at least 1,000 tests in a single day and below the 14-day average of 8.07 percent. The testing total is above the 14-day average of 3,823 tests.
The number of tests processed will likely surge in the coming days. The Wisconsin National Guard alone collected approximately 4,500 samples Monday. Those totals will not be reflected in the state’s daily figures until they are processed.
Governor Tony Evers set a goal of having 85,000 tests per week processed as part of the Badger Bounce Back plan. “Our goal is to regularly conduct 12,000 tests per day,” said DHS deputy secretary Julie Willems Van Dijk during a press briefing Tuesday. But the number of tests processed has never exceeded 5,550 in a single day.
Five of the six gating criteria tracked on a dashboard by DHS as part of the Badger Bounce Back plan are currently satisfied as of Tuesday afternoon, an increase of two over yesterday. The only factor not met is a downward trajectory of influenza-like illnesses reported within a 14-day period. A 14-day trendline points downward, but is not at a level of statistical significance. All six of the criteria are a snapshot in time and can fall out of compliance. The influenza-like illnesses has previously been given the “green light” only to fall back out of the statistical significance figure required.
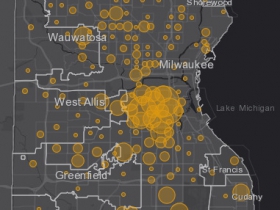
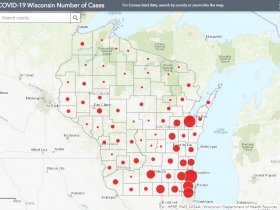
Milwaukee County is the site of 4,069 of the 10,611 confirmed cases and 235 of the 418 deaths according to state data.
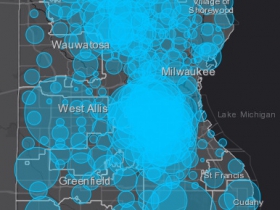
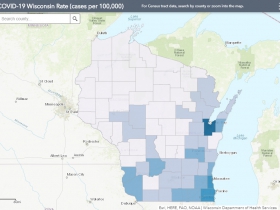
But on a per-capita basis, Brown County has far more cases and the gap between the two continues to grow. A second county, Kenosha, may also soon pass Milwaukee.
Brown County, which is anchored by Green Bay, now has 753.7 cases per 100,000 residents (up from 740.6 yesterday). Milwaukee County has 426.4 cases per 100,000 residents (up from 421.5). On April 16th, Brown County had only 53.5 cases per 100,000 residents while Milwaukee had 204. Brown County now has 20 confirmed deaths and 1,958 confirmed cases.
Kenosha County has the third-highest rate at 425.4 cases per 100,000 residents. Racine (390.5), Walworth (236.9), Rock (228.1), Kewaunee (142.4), Grant (133.1), Ozaukee (121.2), Sauk (114.8), Fond du Lac (105.6), Crawford (104.4) and Waukesha (103.8) are the only other counties with more than 100 cases per 100,000 residents. Fond du Lac County appears on the list for the first time after 21 new cases were reported over the weekend, including six from a single, illegal gathering.
The statewide average of cases per 100,000 residents has risen to 183.6 (up from 180.3).
There are currently 936 ventilators and 423 intensive care unit (ICU) beds available across the state according to the Wisconsin Hospital Association. Since the data became publicly available on April 10th, WHA has reported an average of 926 ventilators and 435 ICU beds as available.
Charts and Maps
Wisconsin COVID-19 summary
| Status | Number (%) of People as of 5/12/2020 |
|---|---|
| Negative Test Results | 112,748 |
| Positive Test Results | 10,611 |
| Hospitalizations | 1,877 (18%) |
| Deaths | 418 |
Percent of COVID-19 cases by hospitalization status
| Hospitilization status | Number of confirmed cases as of 5/12/2020 | Percent of confirmed cases as of 5/12/2020 |
|---|---|---|
| Ever hospitalized | 1,877 | 18% |
| Never hospitalized | 6,221 | 59% |
| Unknown | 2,513 | 24% |
| Total | 10,611 | 100% |
Summary of COVID-19 cases by age group
| Age Group (Years) | Cases as of 5/12/2020 | Ever hospitalized as of 5/12/2020 | Any Intensive Care as of 5/12/2020 | Deaths as of 5/12/2020 |
|---|---|---|---|---|
| <10 | 158 | 7 | 0 | 0 |
| 10-19 | 469 | 16 | 1 | 0 |
| 20-29 | 1726 | 83 | 15 | 4 |
| 30-39 | 1827 | 127 | 22 | 5 |
| 40-49 | 1830 | 215 | 55 | 11 |
| 50-59 | 1796 | 321 | 86 | 33 |
| 60-69 | 1353 | 420 | 129 | 64 |
| 70-79 | 755 | 367 | 94 | 122 |
| 80-89 | 471 | 237 | 46 | 101 |
| 90+ | 226 | 84 | 16 | 78 |
| Total | 10,611 | 1,877 | 464 | 418 |
Percent of COVID-19 cases and deaths by gender
| Gender | Confirmed Cases as of 5/12/2020 | Deaths as of 5/12/2020 |
|---|---|---|
| Female | 50% | 42% |
| Male | 49% | 58% |
| Unknown | 0% | 0% |
| Total Number | 10,611 | 418 |
Confirmed COVID-19 cases and deaths by race
| Race | Number of cases as of 5/12/2020 | Percent of cases as of 5/12/2020 | Number of deaths as of 5/12/2020 | Percent of deaths as of 5/12/2020 |
|---|---|---|---|---|
| American Indian | 122 | 1% | 5 | 1% |
| Asian or Pacific Islander | 381 | 4% | 7 | 2% |
| Black | 2,218 | 21% | 119 | 28% |
| White | 5,728 | 54% | 281 | 67% |
| Multiple or Other races | 1,104 | 10% | 2 | 0% |
| Unknown | 1,058 | 10% | 4 | 1% |
| Total | 10,611 | 100% | 418 | 100% |
Confirmed COVID-19 cases and deaths by ethnicity
| Ethnicity | Number of cases as of 5/12/2020 | Percent of cases as of 5/12/2020 | Number of deaths as of 5/12/2020 | Percent of deaths as of 5/12/2020 |
|---|---|---|---|---|
| Hispanic or Latino | 3,236 | 30% | 32 | 8% |
| Not Hispanic or Latino | 6,261 | 59% | 378 | 90% |
| Unknown | 1,114 | 10% | 8 | 2% |
| Total | 10,611 | 100% | 418 | 100% |
Number of positive cases and deaths by county
| Wisconsin County | Positive as of 5/12/2020 | Negative as of 5/12/2020 | Deaths as of 5/12/2020 | Rate (positive cases per 100,000 people) as of 5/12/2020 | Case fatality percentage (percent of cases who died) as of 5/12/2020 |
|---|---|---|---|---|---|
| Adams | 4 | 305 | 1 | 19.9 | 25% |
| Ashland | 2 | 275 | 0 | 12.7 | 0% |
| Barron | 11 | 1,121 | 0 | 24.3 | 0% |
| Bayfield | 3 | 287 | 1 | 20.0 | 33% |
| Brown | 1,958 | 6,557 | 20 | 753.7 | 1% |
| Buffalo | 5 | 431 | 1 | 38.0 | 20% |
| Burnett | 0 | 239 | 0 | 0.0 | 0% |
| Calumet | 43 | 602 | 1 | 86.3 | 2% |
| Chippewa | 31 | 1,418 | 0 | 48.7 | 0% |
| Clark | 24 | 369 | 4 | 69.6 | 17% |
| Columbia | 34 | 1,215 | 1 | 59.7 | 3% |
| Crawford | 17 | 490 | 0 | 104.4 | 0% |
| Dane | 477 | 14,737 | 22 | 90.0 | 5% |
| Dodge | 75 | 1,652 | 1 | 85.4 | 1% |
| Door | 22 | 409 | 3 | 80.2 | 14% |
| Douglas | 11 | 817 | 0 | 25.3 | 0% |
| Dunn | 14 | 1,306 | 0 | 31.5 | 0% |
| Eau Claire | 60 | 2,729 | 0 | 58.3 | 0% |
| Florence | 2 | 34 | 0 | 46.1 | 0% |
| Fond du Lac | 108 | 2,117 | 3 | 105.6 | 3% |
| Forest | 4 | 199 | 0 | 44.4 | 0% |
| Grant | 69 | 1,369 | 9 | 133.1 | 13% |
| Green | 34 | 680 | 0 | 92.2 | 0% |
| Green Lake | 8 | 297 | 0 | 42.7 | 0% |
| Iowa | 10 | 400 | 0 | 42.3 | 0% |
| Iron | 2 | 60 | 1 | 35.0 | 50% |
| Jackson | 14 | 526 | 1 | 68.3 | 7% |
| Jefferson | 52 | 1,365 | 2 | 61.4 | 4% |
| Juneau | 21 | 550 | 1 | 79.5 | 5% |
| Kenosha | 716 | 3,535 | 16 | 425.4 | 2% |
| Kewaunee | 29 | 287 | 1 | 142.4 | 3% |
| La Crosse | 34 | 2,909 | 0 | 28.9 | 0% |
| Lafayette | 13 | 289 | 0 | 77.7 | 0% |
| Langlade | 0 | 209 | 0 | 0.0 | 0% |
| Lincoln | 1 | 266 | 0 | 3.6 | 0% |
| Manitowoc | 20 | 807 | 1 | 25.2 | 5% |
| Marathon | 25 | 1,223 | 1 | 18.5 | 4% |
| Marinette | 21 | 638 | 1 | 51.8 | 5% |
| Marquette | 3 | 266 | 1 | 19.7 | 33% |
| Menominee | 2 | 123 | 0 | 43.7 | 0% |
| Milwaukee | 4,069 | 22,346 | 235 | 426.4 | 6% |
| Monroe | 15 | 1,314 | 1 | 33.0 | 7% |
| Oconto | 28 | 670 | 0 | 74.6 | 0% |
| Oneida | 7 | 430 | 0 | 19.8 | 0% |
| Outagamie | 117 | 2,469 | 2 | 63.3 | 2% |
| Ozaukee | 107 | 1,269 | 10 | 121.2 | 9% |
| Pepin | 0 | 271 | 0 | 0.0 | 0% |
| Pierce | 14 | 692 | 0 | 33.7 | 0% |
| Polk | 5 | 607 | 0 | 11.5 | 0% |
| Portage | 7 | 620 | 0 | 9.9 | 0% |
| Price | 1 | 154 | 0 | 7.4 | 0% |
| Racine | 763 | 4,135 | 17 | 390.5 | 2% |
| Richland | 13 | 368 | 2 | 74.1 | 15% |
| Rock | 369 | 3,553 | 13 | 228.1 | 4% |
| Rusk | 4 | 181 | 0 | 28.2 | 0% |
| Sauk | 73 | 1,624 | 3 | 114.8 | 4% |
| Sawyer | 4 | 473 | 0 | 24.4 | 0% |
| Shawano | 25 | 620 | 0 | 61.0 | 0% |
| Sheboygan | 66 | 1,410 | 2 | 57.3 | 3% |
| St. Croix | 31 | 1,153 | 0 | 35.3 | 0% |
| Taylor | 0 | 168 | 0 | 0.0 | 0% |
| Trempealeau | 6 | 747 | 0 | 20.4 | 0% |
| Vernon | 4 | 584 | 0 | 13.1 | 0% |
| Vilas | 4 | 232 | 0 | 18.5 | 0% |
| Walworth | 244 | 1,430 | 11 | 236.9 | 5% |
| Washburn | 1 | 280 | 0 | 6.4 | 0% |
| Washington | 119 | 2,301 | 4 | 88.5 | 3% |
| Waukesha | 414 | 5,540 | 23 | 103.8 | 6% |
| Waupaca | 13 | 640 | 1 | 25.3 | 8% |
| Waushara | 4 | 279 | 0 | 16.6 | 0% |
| Winnebago | 101 | 2,075 | 1 | 59.4 | 1% |
| Wood | 4 | 1,005 | 0 | 5.5 | 0% |
| Total | 10,611 | 112,748 | 418 | 183.6 | 4% |
If you think stories like this are important, become a member of Urban Milwaukee and help support real, independent journalism. Plus you get some cool added benefits.
More about the Coronavirus Pandemic
- Governors Tony Evers, JB Pritzker, Tim Walz, and Gretchen Whitmer Issue a Joint Statement Concerning Reports that Donald Trump Gave Russian Dictator Putin American COVID-19 Supplies - Gov. Tony Evers - Oct 11th, 2024
- MHD Release: Milwaukee Health Department Launches COVID-19 Wastewater Testing Dashboard - City of Milwaukee Health Department - Jan 23rd, 2024
- Milwaukee County Announces New Policies Related to COVID-19 Pandemic - David Crowley - May 9th, 2023
- DHS Details End of Emergency COVID-19 Response - Wisconsin Department of Health Services - Apr 26th, 2023
- Milwaukee Health Department Announces Upcoming Changes to COVID-19 Services - City of Milwaukee Health Department - Mar 17th, 2023
- Fitzgerald Applauds Passage of COVID-19 Origin Act - U.S. Rep. Scott Fitzgerald - Mar 10th, 2023
- DHS Expands Free COVID-19 Testing Program - Wisconsin Department of Health Services - Feb 10th, 2023
- MKE County: COVID-19 Hospitalizations Rising - Graham Kilmer - Jan 16th, 2023
- Not Enough Getting Bivalent Booster Shots, State Health Officials Warn - Gaby Vinick - Dec 26th, 2022
- Nearly All Wisconsinites Age 6 Months and Older Now Eligible for Updated COVID-19 Vaccine - Wisconsin Department of Health Services - Dec 15th, 2022
Read more about Coronavirus Pandemic here


