Positive COVID-19 Testing Rate Trending In Wrong Direction
Even as testing expands, average number of people testing positive for disease expands.
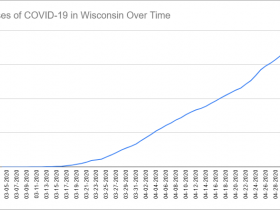
The state shows no signs of being out of the woods on one of the key factors the Department of Health Services is using to gauge the effectiveness of its fight against the COVID-19’s spread.
For the third day in a row, Wisconsin reported over 3,000 tests were processed and over 10 percent came back positive.
The increased testing totals are a positive sign, besting the April average of 1,917, but they’re still below the reported testing capacity of 11,147 tests at 50 labs.
And while testing is trending in a positive direction, the percentage of those tests that are coming back positive is trending up, which is not what public health officials want to see.
“The trend is the important thing,” said Dr. Ryan Westergaard, Chief Medical Officer of the DHS Bureau of Communicable Diseases, during a briefing Wednesday. “We want to see a sustained move in the right direction. We have been a little flat going between nine and 11 percent.”
The state averaged a positive test rate of 9.57 percent in April. But over the past 14 days that figure jumped to 9.87 percent and 9.66 percent in the past week. For the past three days it’s been 11.3 percent.
DHS reported Saturday that 3,350 people were tested in the past 24 hours, 346 of which came back positive (10.33 percent).
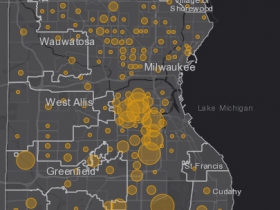
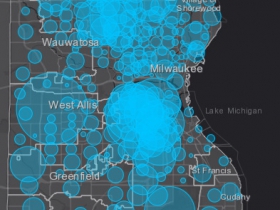
The death toll from the virus has reached 334, with seven new deaths in the past 24 hours. DHS reports that 191 of the deaths have occurred in Milwaukee County. The county’s residents represent 3,147 of the 7,660 confirmed cases according to state data. Testing access has increased in Milwaukee with community health centers and Walgreens launching drive-thru testing.
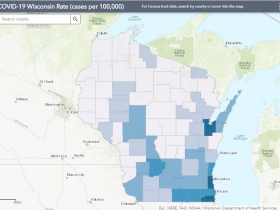
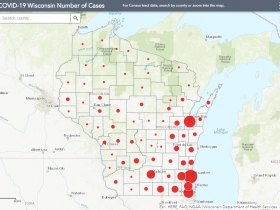
The gap between the percentage of residents with a confirmed case inMilwaukee and Brown counties to grow. Brown County, which is anchored by Green Bay, now has 489.6 cases per 100,000 residents (up from 452.3 yesterday). Milwaukee County has 329.8 cases per 100,000 residents (up from 319). On April 16th, Brown County had only 53.5 cases per 100,000 residents while Milwaukee had 204. Brown County has now reported five deaths.
Kenosha County has the third-highest rate at 309.5 cases per 100,000 residents. Racine (208.8), Walworth (177.6), Rock (150.2), Sauk (100.6) and Ozaukee (100.8) are the only other counties with more than 100 cases per 100,000 residents, the latter two crossing the threshold for the first time in the last 24 hours. The statewide average has risen to 132.6 (up from 126.6).
The cumulative hospitalization rate for those with confirmed cases stands at 21 percent (1,591 people) over the length of the outbreak after peaking at 30 percent, but the state does not have hospitalization data in 21 percent of cases (1,631 cases).
There are currently 969 ventilators and 418 intensive care unit beds available across the state according to the Wisconsin Hospital Association. Since the data became publicly available on April 10th, WHA has reported an average of 921 ventilators and 446.25 intensive care unit beds as available.
Charts and Maps
Wisconsin COVID-19 summary
| Status | Number (%) of People as of 5/2/2020 |
|---|---|
| Negative Test Results | 75,570 |
| Positive Test Results | 7,660 |
| Hospitalizations | 1,591 (21%) |
| Deaths | 334 |
Percent of COVID-19 cases and deaths by gender
| Gender | Confirmed Cases as of 5/2/2020 | Deaths as of 5/2/2020 |
|---|---|---|
| Female | 50% | 40% |
| Male | 50% | 60% |
| Total Number | 7,660 | 334 |
Confirmed COVID-19 cases and deaths by race
| Race | Number of cases as of 5/2/2020 | Percent of cases as of 5/2/2020 | Number of deaths as of 5/2/2020 | Percent of deaths as of 5/2/2020 |
|---|---|---|---|---|
| American Indian | 73 | 1% | 4 | 1% |
| Asian or Pacific Islander | 259 | 3% | 6 | 2% |
| Black | 1,718 | 22% | 105 | 31% |
| White | 4,039 | 53% | 208 | 62% |
| Multiple or Other races | 692 | 9% | 2 | 1% |
| Unknown | 879 | 11% | 9 | 3% |
| Total | 7,660 | 100% | 334 | 100% |
Confirmed COVID-19 cases and deaths by ethnicity
| Ethnicity | Number of cases as of 5/2/2020 | Percent of cases as of 5/2/2020 | Number of deaths as of 5/2/2020 | Percent of deaths as of 5/2/2020 |
|---|---|---|---|---|
| Hispanic or Latino | 2,024 | 26% | 21 | 6% |
| Not Hispanic or Latino | 4,702 | 61% | 296 | 89% |
| Unknown | 934 | 12% | 17 | 5% |
| Total | 7,660 | 100% | 334 | 100% |
Percent of COVID-19 cases by hospitalization status
| Hospitilization status | Number of confirmed cases as of 5/2/2020 | Percent of confirmed cases as of 5/2/2020 |
|---|---|---|
| Ever hospitalized | 1,591 | 21% |
| Never hospitalized | 4,438 | 58% |
| Unknown | 1,631 | 21% |
| Total | 7,660 | 100% |
Summary of COVID-19 cases by age group
| Age Group (Years) | Cases as of 5/2/2020 | Ever hospitalized as of 5/2/2020 | Any Intensive Care as of 5/2/2020 | Deaths as of 5/2/2020 |
|---|---|---|---|---|
| <10 | 82 | 7 | 0 | 0 |
| 10-19 | 228 | 12 | 1 | 0 |
| 20-29 | 1145 | 65 | 9 | 3 |
| 30-39 | 1261 | 103 | 19 | 4 |
| 40-49 | 1337 | 168 | 40 | 10 |
| 50-59 | 1387 | 282 | 77 | 30 |
| 60-69 | 1049 | 350 | 113 | 51 |
| 70-79 | 609 | 317 | 83 | 101 |
| 80-89 | 389 | 213 | 43 | 82 |
| 90+ | 173 | 74 | 15 | 53 |
| Total | 7,660 | 1,591 | 400 | 334 |
Number of positive cases and deaths by county
| Wisconsin County | Positive as of 5/2/2020 | Negative as of 5/2/2020 | Deaths as of 5/2/2020 | Rate (positive cases per 100,000 people) as of 5/2/2020 | Case fatality percentage (percent of cases who died) as of 5/2/2020 |
|---|---|---|---|---|---|
| Adams | 4 | 177 | 1 | 19.9 | 25% |
| Ashland | 2 | 140 | 0 | 12.7 | 0% |
| Barron | 7 | 783 | 0 | 15.5 | 0% |
| Bayfield | 3 | 196 | 1 | 20.0 | 33% |
| Brown | 1,272 | 3,547 | 6 | 489.6 | 0% |
| Buffalo | 4 | 195 | 1 | 30.4 | 25% |
| Burnett | 0 | 103 | 0 | 0.0 | 0% |
| Calumet | 16 | 391 | 0 | 32.1 | 0% |
| Chippewa | 23 | 1,048 | 0 | 36.1 | 0% |
| Clark | 20 | 245 | 4 | 58.0 | 20% |
| Columbia | 29 | 855 | 1 | 50.9 | 3% |
| Crawford | 4 | 240 | 0 | 24.6 | 0% |
| Dane | 433 | 11,212 | 22 | 81.7 | 5% |
| Dodge | 38 | 1,006 | 1 | 43.3 | 3% |
| Door | 14 | 175 | 3 | 51.0 | 21% |
| Douglas | 9 | 530 | 0 | 20.7 | 0% |
| Dunn | 10 | 1,013 | 0 | 22.5 | 0% |
| Eau Claire | 34 | 2,007 | 0 | 33.0 | 0% |
| Florence | 2 | 24 | 0 | 46.1 | 0% |
| Fond du Lac | 73 | 1,456 | 3 | 71.3 | 4% |
| Forest | 0 | 79 | 0 | 0.0 | 0% |
| Grant | 43 | 810 | 6 | 83.0 | 14% |
| Green | 13 | 368 | 0 | 35.3 | 0% |
| Green Lake | 3 | 194 | 0 | 16.0 | 0% |
| Iowa | 7 | 289 | 0 | 29.6 | 0% |
| Iron | 2 | 41 | 1 | 35.0 | 50% |
| Jackson | 12 | 345 | 1 | 58.5 | 8% |
| Jefferson | 46 | 988 | 0 | 54.3 | 0% |
| Juneau | 18 | 387 | 1 | 68.1 | 6% |
| Kenosha | 521 | 2,043 | 13 | 309.5 | 2% |
| Kewaunee | 15 | 149 | 1 | 73.7 | 7% |
| La Crosse | 29 | 2,212 | 0 | 24.6 | 0% |
| Lafayette | 6 | 136 | 0 | 35.9 | 0% |
| Langlade | 0 | 130 | 0 | 0.0 | 0% |
| Lincoln | 1 | 188 | 0 | 3.6 | 0% |
| Manitowoc | 13 | 425 | 1 | 16.4 | 8% |
| Marathon | 19 | 783 | 1 | 14.0 | 5% |
| Marinette | 10 | 414 | 1 | 24.7 | 10% |
| Marquette | 3 | 176 | 1 | 19.7 | 33% |
| Menominee | 1 | 74 | 0 | 21.8 | 0% |
| Milwaukee | 3,147 | 15,898 | 191 | 329.8 | 6% |
| Monroe | 14 | 820 | 1 | 30.8 | 7% |
| Oconto | 15 | 340 | 0 | 39.9 | 0% |
| Oneida | 6 | 299 | 0 | 17.0 | 0% |
| Outagamie | 63 | 1,456 | 2 | 34.1 | 3% |
| Ozaukee | 89 | 994 | 9 | 100.8 | 10% |
| Pepin | 0 | 119 | 0 | 0.0 | 0% |
| Pierce | 10 | 445 | 0 | 24.0 | 0% |
| Polk | 4 | 327 | 0 | 9.2 | 0% |
| Portage | 6 | 356 | 0 | 8.5 | 0% |
| Price | 1 | 99 | 0 | 7.4 | 0% |
| Racine | 408 | 2,517 | 13 | 208.8 | 3% |
| Richland | 12 | 270 | 2 | 68.4 | 17% |
| Rock | 243 | 2,217 | 7 | 150.2 | 3% |
| Rusk | 4 | 130 | 0 | 28.2 | 0% |
| Sauk | 64 | 967 | 3 | 100.6 | 5% |
| Sawyer | 3 | 270 | 0 | 18.3 | 0% |
| Shawano | 16 | 382 | 0 | 39.0 | 0% |
| Sheboygan | 51 | 933 | 2 | 44.3 | 4% |
| St. Croix | 16 | 575 | 0 | 18.2 | 0% |
| Taylor | 0 | 116 | 0 | 0.0 | 0% |
| Trempealeau | 3 | 536 | 0 | 10.2 | 0% |
| Vernon | 1 | 436 | 0 | 3.3 | 0% |
| Vilas | 4 | 153 | 0 | 18.5 | 0% |
| Walworth | 183 | 918 | 8 | 177.6 | 4% |
| Washburn | 1 | 175 | 0 | 6.4 | 0% |
| Washington | 100 | 1,846 | 4 | 74.3 | 4% |
| Waukesha | 356 | 3,994 | 20 | 89.3 | 6% |
| Waupaca | 10 | 397 | 1 | 19.4 | 10% |
| Waushara | 2 | 184 | 0 | 8.3 | 0% |
| Winnebago | 67 | 1,324 | 1 | 39.4 | 1% |
| Wood | 2 | 503 | 0 | 2.7 | 0% |
| Total | 7,660 | 75,570 | 334 | 132.6 | 4% |
-Data from the State of Wisconsin Department of Health Services.
If you think stories like this are important, become a member of Urban Milwaukee and help support real, independent journalism. Plus you get some cool added benefits.
More about the Coronavirus Pandemic
- Governors Tony Evers, JB Pritzker, Tim Walz, and Gretchen Whitmer Issue a Joint Statement Concerning Reports that Donald Trump Gave Russian Dictator Putin American COVID-19 Supplies - Gov. Tony Evers - Oct 11th, 2024
- MHD Release: Milwaukee Health Department Launches COVID-19 Wastewater Testing Dashboard - City of Milwaukee Health Department - Jan 23rd, 2024
- Milwaukee County Announces New Policies Related to COVID-19 Pandemic - David Crowley - May 9th, 2023
- DHS Details End of Emergency COVID-19 Response - Wisconsin Department of Health Services - Apr 26th, 2023
- Milwaukee Health Department Announces Upcoming Changes to COVID-19 Services - City of Milwaukee Health Department - Mar 17th, 2023
- Fitzgerald Applauds Passage of COVID-19 Origin Act - U.S. Rep. Scott Fitzgerald - Mar 10th, 2023
- DHS Expands Free COVID-19 Testing Program - Wisconsin Department of Health Services - Feb 10th, 2023
- MKE County: COVID-19 Hospitalizations Rising - Graham Kilmer - Jan 16th, 2023
- Not Enough Getting Bivalent Booster Shots, State Health Officials Warn - Gaby Vinick - Dec 26th, 2022
- Nearly All Wisconsinites Age 6 Months and Older Now Eligible for Updated COVID-19 Vaccine - Wisconsin Department of Health Services - Dec 15th, 2022
Read more about Coronavirus Pandemic here


