Wisconsin COVID-19 Testing Grows 69 Percent Week Over Week
But the percentage of tests coming back positive isn't falling dramatically.
COVID-19 continues to spread across Wisconsin even as testing increases according to new figures from the Wisconsin Department of Health Services. Week-over-week, the number of tests processed was up 69 percent.
But even with the increase in testing, the 3,098 tests processed over the past 24 hours is below the state’s reported capacity of 11,047 tests.
The number of tests coming back positive set a new high on Thursday at 334. The increase comes as the state reported a positive test rate of 10.78 percent in the past day, exceeding the April average of 9.57 percent.
The percent of new tests coming back positive went above 10 percent for the first time in five days. The figure is one of six criteria the state is monitoring as part of the Badger Bounce Back plan.
“The trend is the important thing,” said Dr. Ryan Westergaard, Chief Medical Officer of the DHS Bureau of Communicable Diseases, during a briefing Wednesday. “We want to see a sustained move in the right direction. We have been a little flat going between nine and 11 percent.”
Even as testing has expanded in the past week, the rate has not fallen dramatically. Over the past seven days 9.1 percent of tests have been positive while testing has increased 69 percent week-over-week.
A total of 3,098 tests were processed in the past 24 hours, the third-highest total reported over the length of the outbreak. DHS reported a daily testing capacity of 11,047 across 50 labs.
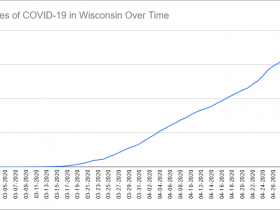
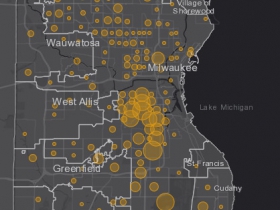
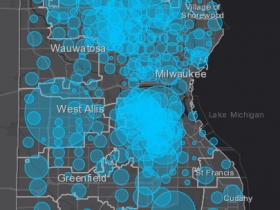
The death toll from the virus has reached 316, with eight new deaths in the past 24 hours. DHS reports that 181 of the deaths have occurred in Milwaukee County. The county’s residents represent 2,940 of the 6,854 confirmed cases according to state data. Testing access has increased in Milwaukee with community health centers launching drive-thru testing.
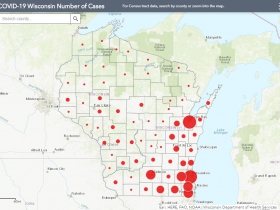
But the gap between the percentage of residents with a confirmed case between Milwaukee and Brown counties to grow. Brown County, which is anchored by Green Bay, now has 406.9 cases per 100,000 residents (up from 373.8 yesterday). Milwaukee County has 308.1 cases per 100,000 residents (up from 295). On April 16th, Brown County had only 53.5 cases per 100,000 residents while Milwaukee had 204.
Kenosha County has the third-highest rate at 215.6 cases per 100,000 residents. Racine (181.7), Walworth (156.4) and Rock (122.4) are the only other counties with more than 100 cases per 100,000 residents, but the statewide average has risen to 118.6 (up from 112.8).
The cumulative hospitalization rate for those with confirmed cases has fallen to 22 percent (1,512 people) over the length of the outbreak after peaking at 30 percent, but the state does not have hospitalization data in 20 percent of cases (1,388 cases).
There are currently 948 ventilators and 434 intensive care unit beds available across the state according to the Wisconsin Hospital Association. Since the data became publicly available on April 10th, WHA has reported an average of 918 ventilators and 450 intensive care unit beds as available.
Charts and Maps
Wisconsin COVID-19 summary
| Status | Number (%) of People as of 4/30/2020 |
|---|---|
| Negative Test Results | 69,394 |
| Positive Test Results | 6,854 |
| Hospitalizations | 1,512 (22%) |
| Deaths | 316 |
Percent of COVID-19 cases by hospitalization status
| Hospitilization status | Number of confirmed cases as of 4/30/2020 | Percent of confirmed cases as of 4/30/2020 |
|---|---|---|
| Ever hospitalized | 1,512 | 22% |
| Never hospitalized | 3,954 | 58% |
| Unknown | 1,388 | 20% |
| Total | 6,854 | 100% |
Summary of COVID-19 cases by age group
| Age Group (Years) | Cases as of 4/30/2020 | Ever hospitalized as of 4/30/2020 | Any Intensive Care as of 4/30/2020 | Deaths as of 4/30/2020 |
|---|---|---|---|---|
| <10 | 63 | 5 | 0 | 0 |
| 10-19 | 182 | 9 | 1 | 0 |
| 20-29 | 994 | 60 | 8 | 3 |
| 30-39 | 1119 | 95 | 19 | 4 |
| 40-49 | 1197 | 158 | 37 | 9 |
| 50-59 | 1257 | 268 | 75 | 26 |
| 60-69 | 977 | 335 | 108 | 49 |
| 70-79 | 569 | 314 | 81 | 100 |
| 80-89 | 349 | 201 | 39 | 77 |
| 90+ | 147 | 67 | 14 | 48 |
| Total | 6,854 | 1,512 | 382 | 316 |
Confirmed COVID-19 cases and deaths by race
| Race | Number of cases as of 4/30/2020 | Percent of cases as of 4/30/2020 | Number of deaths as of 4/30/2020 | Percent of deaths as of 4/30/2020 |
|---|---|---|---|---|
| American Indian | 67 | 1% | 4 | 1% |
| Asian or Pacific Islander | 221 | 3% | 5 | 2% |
| Black | 1,607 | 23% | 102 | 32% |
| White | 3,613 | 53% | 191 | 60% |
| Multiple or Other races | 513 | 7% | 3 | 1% |
| Unknown | 833 | 12% | 11 | 3% |
| Total | 6,854 | 100% | 316 | 100% |
Confirmed COVID-19 cases and deaths by ethnicity
| Ethnicity | Number of cases as of 4/30/2020 | Percent of cases as of 4/30/2020 | Number of deaths as of 4/30/2020 | Percent of deaths as of 4/30/2020 |
|---|---|---|---|---|
| Hispanic or Latino | 1,725 | 25% | 17 | 5% |
| Not Hispanic or Latino | 4,272 | 62% | 281 | 89% |
| Unknown | 857 | 13% | 18 | 6% |
| Total | 6,854 | 100% | 316 | 100% |
Summary of COVID-19 cases by age group
| Age Group (Years) | Cases as of 4/30/2020 | Ever hospitalized as of 4/30/2020 | Any Intensive Care as of 4/30/2020 | Deaths as of 4/30/2020 |
|---|---|---|---|---|
| <10 | 63 | 5 | 0 | 0 |
| 10-19 | 182 | 9 | 1 | 0 |
| 20-29 | 994 | 60 | 8 | 3 |
| 30-39 | 1119 | 95 | 19 | 4 |
| 40-49 | 1197 | 158 | 37 | 9 |
| 50-59 | 1257 | 268 | 75 | 26 |
| 60-69 | 977 | 335 | 108 | 49 |
| 70-79 | 569 | 314 | 81 | 100 |
| 80-89 | 349 | 201 | 39 | 77 |
| 90+ | 147 | 67 | 14 | 48 |
| Total | 6,854 | 1,512 | 382 | 316 |
-Data from the State of Wisconsin Department of Health Services.


