Positive Case Rate Falls, But State Wants It Even Lower
New webpage allows public to track progress on criteria in Badger Bounce Back plan.
The Wisconsin Department of Health Services reported the second-highest one-day COVID-19 testing total on record Wednesday with 3,326 people tested. The figure trails only the 3,421 tests reported on April 24th.But the percentage of people testing positive was the lowest reported in over across the month. In the past 24 hours, 6.95 percent of individuals tested recorded a positive test, below the April average of 9.5 percent.
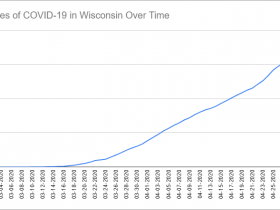
With the reduced percentage, 231 new cases were reported, bringing the total to 6,520 over the length of the outbreak.
The positive test rate is one of six criteria the state is monitoring as part of the Badger Bounce Back plan.
“The trend is the important thing,” said Dr. Ryan Westergaard, Chief Medical Officer of the DHS Bureau of Communicable Diseases, during a briefing Wednesday. “We want to see a sustained move in the right direction. We have been a little flat going between nine and 11 percent.”
“What is the precise number? It depends on how widely we can do testing,” said Westergaard. He cautioned that expanding testing would drop the percentage, but a downward trend would still need to be established.
“Anyone that needs a test in the state of Wisconsin should be able to get a test and we really need our healthcare partners in the state to help us with that,” said Governor Tony Evers.
A new state webpage provides public information on the state’s progress in meeting the criteria of the bounce back plan, including the number of people showing symptoms of COVID-19. But information on progress on criteria with regard to personal protective equipment supplies, contact tracing and testing results turnaround are missing. “Criteria are currently under development in partnership with Wisconsin healthcare stakeholders,” says the page.
The death toll from the virus has reached 308, with eight new deaths in the past 24 hours. DHS reports that 177 of the deaths have occurred in Milwaukee County.
The cumulative hospitalization rate for those with confirmed cases stands at 23 percent (1,489 people) over the length of the outbreak after peaking at 30 percent, but the state does not have hospitalization data in 19 percent of cases (1,215 cases).
There are currently 924 ventilators and 451 intensive care unit beds available across the state according to the Wisconsin Hospital Association. Since the data became publicly available on April 10th, WHA has reported an average of 916 ventilators and 452 intensive care unit beds as available.
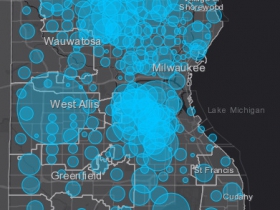
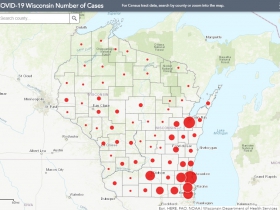
The gap between the percent of cases for residents in Brown County versus other Wisconsin counties continues to grow. The county, which is anchored by Green Bay, now has 373.8 cases per 100,000 residents (up from 354.1 yesterday). Milwaukee County has 295 cases per 100,000 residents (up from 285.3). On April 16th, Brown County had only 53.5 cases per 100,000 residents while Milwaukee was at 204.
Kenosha County has the third-highest rate at 215.6 cases per 100,000 residents. Racine (162.2), Walworth (151.4) and Rock (113.1) are the only other counties with more than 100 cases per 100,000 residents, but the statewide average has risen to 112.8.
Charts and Maps
Wisconsin COVID-19 summary
| Status | Number (%) of People as of 4/29/2020 |
|---|---|
| Negative Test Results | 66,630 |
| Positive Test Results | 6,520 |
| Hospitalizations | 1,489 (23%) |
| Deaths | 308 |
Percent of COVID-19 cases and deaths by gender
| Gender | Confirmed Cases as of 4/29/2020 | Deaths as of 4/29/2020 |
|---|---|---|
| Female | 51% | 40% |
| Male | 49% | 60% |
| Total Number | 6,520 | 308 |
Confirmed COVID-19 cases and deaths by race
| Race | Number of cases as of 4/29/2020 | Percent of cases as of 4/29/2020 | Number of deaths as of 4/29/2020 | Percent of deaths as of 4/29/2020 |
|---|---|---|---|---|
| American Indian | 61 | 1% | 4 | 1% |
| Asian or Pacific Islander | 205 | 3% | 5 | 2% |
| Black | 1,517 | 23% | 101 | 33% |
| White | 3,449 | 53% | 187 | 61% |
| Multiple or Other races | 470 | 7% | 3 | 1% |
| Unknown | 818 | 13% | 8 | 3% |
| Total | 6,520 | 100% | 308 | 100% |
Confirmed COVID-19 cases and deaths by ethnicity
| Ethnicity | Number of cases as of 4/29/2020 | Percent of cases as of 4/29/2020 | Number of deaths as of 4/29/2020 | Percent of deaths as of 4/29/2020 |
|---|---|---|---|---|
| Hispanic or Latino | 1,602 | 25% | 17 | 6% |
| Not Hispanic or Latino | 4,047 | 62% | 277 | 90% |
| Unknown | 871 | 13% | 14 | 5% |
| Total | 6,520 | 100% | 308 | 100% |
Percent of COVID-19 cases by hospitalization status
| Hospitilization status | Number of confirmed cases as of 4/29/2020 | Percent of confirmed cases as of 4/29/2020 |
|---|---|---|
| Ever hospitalized | 1,489 | 23% |
| Never hospitalized | 3,755 | 58% |
| Unknown | 1,276 | 20% |
| Total | 6,520 | 100% |
Summary of COVID-19 cases by age group
| Age Group (Years) | Cases as of 4/29/2020 | Ever hospitalized as of 4/29/2020 | Any Intensive Care as of 4/29/2020 | Deaths as of 4/29/2020 |
|---|---|---|---|---|
| <10 | 60 | 5 | 0 | 0 |
| 10-19 | 166 | 9 | 1 | 0 |
| 20-29 | 934 | 58 | 7 | 3 |
| 30-39 | 1051 | 94 | 19 | 4 |
| 40-49 | 1128 | 155 | 36 | 9 |
| 50-59 | 1202 | 263 | 75 | 26 |
| 60-69 | 935 | 327 | 105 | 48 |
| 70-79 | 556 | 313 | 78 | 96 |
| 80-89 | 345 | 199 | 38 | 77 |
| 90+ | 143 | 66 | 14 | 45 |
| Total | 6,520 | 1,489 | 373 | 308 |
Number of positive cases and deaths by county
| Wisconsin County | Positive as of 4/29/2020 | Negative as of 4/29/2020 | Deaths as of 4/29/2020 | Rate (positive cases per 100,000 people) as of 4/29/2020 | Case fatality percentage (percent of cases who died) as of 4/29/2020 |
|---|---|---|---|---|---|
| Adams | 4 | 155 | 1 | 19.9 | 25% |
| Ashland | 2 | 129 | 0 | 12.7 | 0% |
| Barron | 6 | 724 | 0 | 13.3 | 0% |
| Bayfield | 3 | 184 | 1 | 20.0 | 33% |
| Brown | 971 | 2,566 | 3 | 373.8 | 0% |
| Buffalo | 4 | 180 | 1 | 30.4 | 25% |
| Burnett | 0 | 82 | 0 | 0.0 | 0% |
| Calumet | 12 | 354 | 0 | 24.1 | 0% |
| Chippewa | 21 | 962 | 0 | 33.0 | 0% |
| Clark | 20 | 211 | 4 | 58.0 | 20% |
| Columbia | 27 | 745 | 1 | 47.4 | 4% |
| Crawford | 3 | 215 | 0 | 18.4 | 0% |
| Dane | 424 | 10,323 | 22 | 80.0 | 5% |
| Dodge | 33 | 890 | 1 | 37.6 | 3% |
| Door | 12 | 128 | 2 | 43.7 | 17% |
| Douglas | 9 | 494 | 0 | 20.7 | 0% |
| Dunn | 9 | 933 | 0 | 20.2 | 0% |
| Eau Claire | 27 | 1,795 | 0 | 26.2 | 0% |
| Florence | 2 | 21 | 0 | 46.1 | 0% |
| Fond du Lac | 69 | 1,332 | 3 | 67.4 | 4% |
| Forest | 0 | 52 | 0 | 0.0 | 0% |
| Grant | 35 | 751 | 6 | 67.5 | 17% |
| Green | 11 | 314 | 0 | 29.8 | 0% |
| Green Lake | 2 | 174 | 0 | 10.7 | 0% |
| Iowa | 7 | 257 | 0 | 29.6 | 0% |
| Iron | 2 | 40 | 1 | 35.0 | 50% |
| Jackson | 12 | 282 | 1 | 58.5 | 8% |
| Jefferson | 45 | 873 | 0 | 53.2 | 0% |
| Juneau | 14 | 341 | 1 | 53.0 | 7% |
| Kenosha | 363 | 1,865 | 11 | 215.6 | 3% |
| Kewaunee | 14 | 120 | 1 | 68.8 | 7% |
| La Crosse | 27 | 2,045 | 0 | 22.9 | 0% |
| Lafayette | 4 | 109 | 0 | 23.9 | 0% |
| Langlade | 0 | 106 | 0 | 0.0 | 0% |
| Lincoln | 0 | 177 | 0 | 0.0 | 0% |
| Manitowoc | 11 | 356 | 1 | 13.9 | 9% |
| Marathon | 17 | 647 | 1 | 12.6 | 6% |
| Marinette | 7 | 357 | 1 | 17.3 | 14% |
| Marquette | 3 | 162 | 1 | 19.7 | 33% |
| Menominee | 1 | 49 | 0 | 21.8 | 0% |
| Milwaukee | 2,815 | 14,119 | 177 | 295.0 | 6% |
| Monroe | 14 | 734 | 1 | 30.8 | 7% |
| Oconto | 8 | 271 | 0 | 21.3 | 0% |
| Oneida | 6 | 274 | 0 | 17.0 | 0% |
| Outagamie | 54 | 1,272 | 2 | 29.2 | 4% |
| Ozaukee | 86 | 890 | 9 | 97.4 | 10% |
| Pepin | 0 | 111 | 0 | 0.0 | 0% |
| Pierce | 10 | 397 | 0 | 24.0 | 0% |
| Polk | 4 | 276 | 0 | 9.2 | 0% |
| Portage | 5 | 282 | 0 | 7.1 | 0% |
| Price | 1 | 81 | 0 | 7.4 | 0% |
| Racine | 317 | 2,121 | 12 | 162.2 | 4% |
| Richland | 11 | 245 | 2 | 62.7 | 18% |
| Rock | 183 | 1,797 | 6 | 113.1 | 3% |
| Rusk | 4 | 118 | 0 | 28.2 | 0% |
| Sauk | 44 | 753 | 3 | 69.2 | 7% |
| Sawyer | 3 | 253 | 0 | 18.3 | 0% |
| Shawano | 10 | 316 | 0 | 24.4 | 0% |
| Sheboygan | 46 | 828 | 2 | 39.9 | 4% |
| St. Croix | 13 | 489 | 0 | 14.8 | 0% |
| Taylor | 0 | 99 | 0 | 0.0 | 0% |
| Trempealeau | 2 | 486 | 0 | 6.8 | 0% |
| Vernon | 1 | 396 | 0 | 3.3 | 0% |
| Vilas | 4 | 132 | 0 | 18.5 | 0% |
| Walworth | 156 | 797 | 8 | 151.4 | 5% |
| Washburn | 1 | 161 | 0 | 6.4 | 0% |
| Washington | 97 | 1,686 | 4 | 72.1 | 4% |
| Waukesha | 329 | 3,592 | 16 | 82.5 | 5% |
| Waupaca | 8 | 364 | 1 | 15.6 | 13% |
| Waushara | 2 | 171 | 0 | 8.3 | 0% |
| Winnebago | 51 | 1,188 | 1 | 30.0 | 2% |
| Wood | 2 | 431 | 0 | 2.7 | 0% |
| Total | 6,520 | 66,630 | 308 | 112.8 | 5% |
-Data from the State of Wisconsin Department of Health Services.
If you think stories like this are important, become a member of Urban Milwaukee and help support real, independent journalism. Plus you get some cool added benefits.
More about the Coronavirus Pandemic
- Governors Tony Evers, JB Pritzker, Tim Walz, and Gretchen Whitmer Issue a Joint Statement Concerning Reports that Donald Trump Gave Russian Dictator Putin American COVID-19 Supplies - Gov. Tony Evers - Oct 11th, 2024
- MHD Release: Milwaukee Health Department Launches COVID-19 Wastewater Testing Dashboard - City of Milwaukee Health Department - Jan 23rd, 2024
- Milwaukee County Announces New Policies Related to COVID-19 Pandemic - David Crowley - May 9th, 2023
- DHS Details End of Emergency COVID-19 Response - Wisconsin Department of Health Services - Apr 26th, 2023
- Milwaukee Health Department Announces Upcoming Changes to COVID-19 Services - City of Milwaukee Health Department - Mar 17th, 2023
- Fitzgerald Applauds Passage of COVID-19 Origin Act - U.S. Rep. Scott Fitzgerald - Mar 10th, 2023
- DHS Expands Free COVID-19 Testing Program - Wisconsin Department of Health Services - Feb 10th, 2023
- MKE County: COVID-19 Hospitalizations Rising - Graham Kilmer - Jan 16th, 2023
- Not Enough Getting Bivalent Booster Shots, State Health Officials Warn - Gaby Vinick - Dec 26th, 2022
- Nearly All Wisconsinites Age 6 Months and Older Now Eligible for Updated COVID-19 Vaccine - Wisconsin Department of Health Services - Dec 15th, 2022
Read more about Coronavirus Pandemic here


