What’s Causing Decline in Insured Children?
Health insurance for kids declined in some states including Wisconsin under Walker. Why?

Doctor.
Since the start of this century, the number of children without health insurance has steadily declined, as the graph below (yellow line) shows. This decline is largely attributable to an increasing number of children enrolling in Medicaid and CHIP (Children’s Health Insurance Program). Both are state-run programs that are heavily subsidized by the federal government. In Wisconsin, both streams of federal funds are integrated into Badgercare Plus.
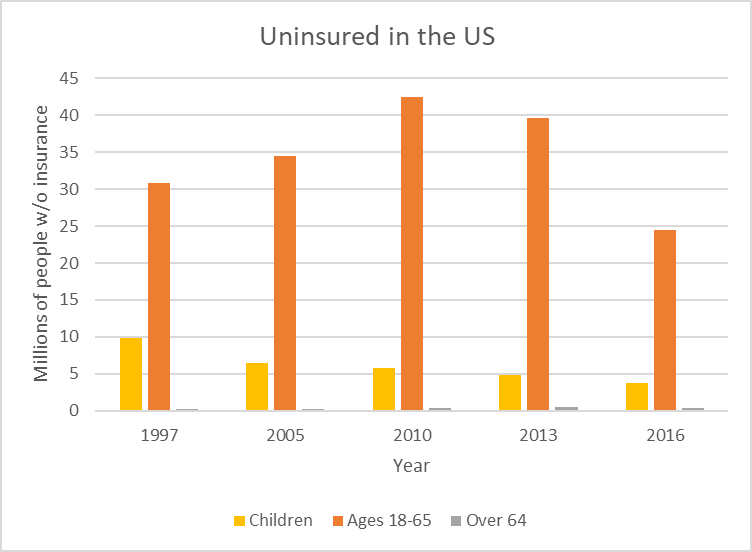
Uninsured in the US
As the same graph shows, the pattern for children stands in sharp contrast to that of adults. In the first decade of this century the number of adults without insurance surged in the wake of the Great Recession as employees lost insurance coverage along with their jobs. The number of uninsured between ages 18 and 64 was finally brought down by two provision in the Affordable Care Act (Obamacare): the expansion of Medicaid and subsidized insurance through the exchanges.
For those 65 and over, the goal of universal coverage has been largely achieved. Medicare covers practically everyone.Unfortunately, there is growing evidence that the long-term downward trend line is reversing—that the number of children without health insurance is increasing. This evidence comes from two sources: sampling by the Census Bureau and analysis by the Centers for Medicare and Medicaid of enrollment state-based enrollment of children in Medicaid and CHIP. Both these measures have limitations.
The next graph shows Census’ estimates of the numbers of children covered by private health insurance (in green), those covered by public programs (in blue), and those without insurance (in yellow), starting in 2008 and ending in 2018. As before, in the wake of the Great Recession, the number of children with private insurance fell, while those in public plans increased, resulting in the number without insurance being cut in half between 2008 and 2012. (I took the numbers of 2017 and 2018 from a September 2018 Census report, Health Insurance Coverage in the United States: 2018, and those for earlier years from a Census excel spreadsheet, HIC-5. Health Insurance Coverage Status and Type of Coverage by State–Children Under 19: 2008 to 2018 .)
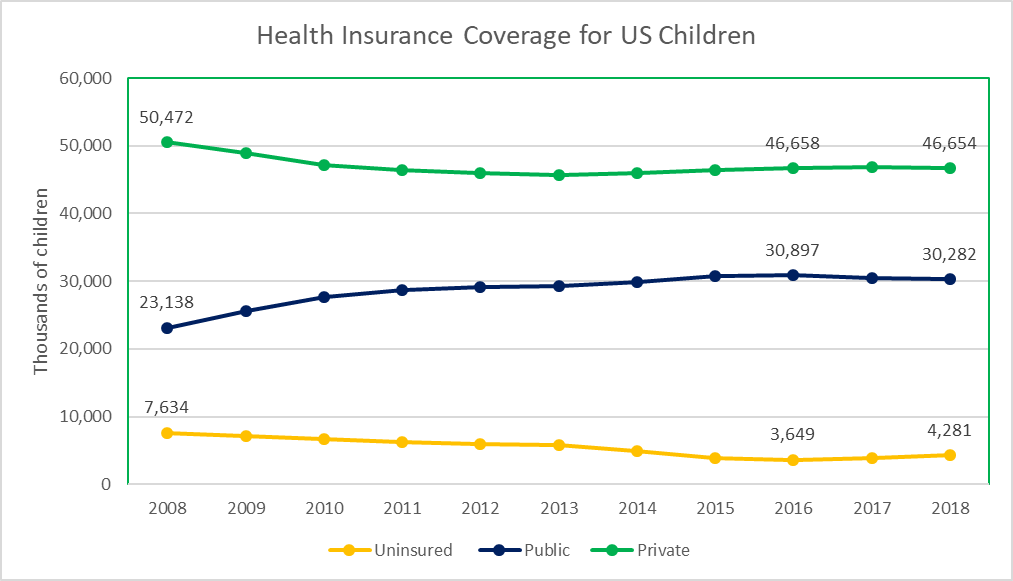
Health Insurance Coverage for US Children
Between 2016 and 2018, it appears that about 600,000 children left public plans, leading to an increase of uninsured children by about the same amount. As shown in the chart below, private insurance enrollment was essentially flat.
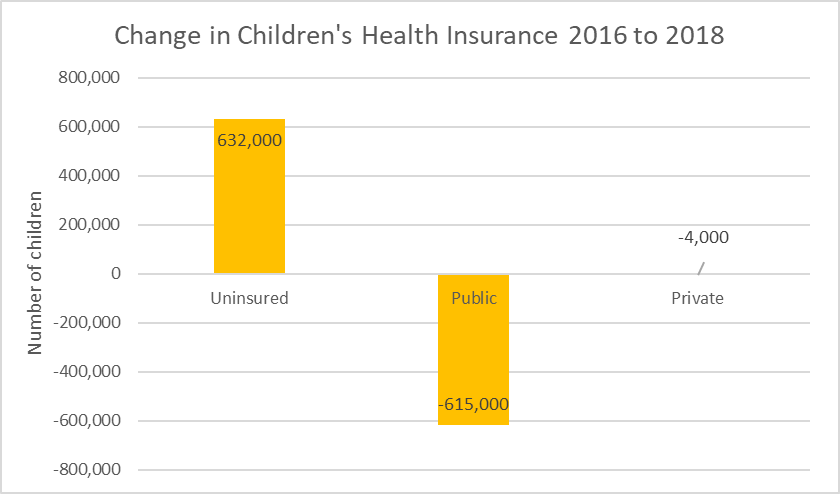
Change in Children’s Health Insurance 2016 to 2018
The next graph shows Census estimates for Wisconsin enrollment of children. Early in the period, there is a movement from private to public plans, like that nationally. Recent fluctuations in Wisconsin are well below the margin of error, implying that one should be very cautious at identifying any trends.
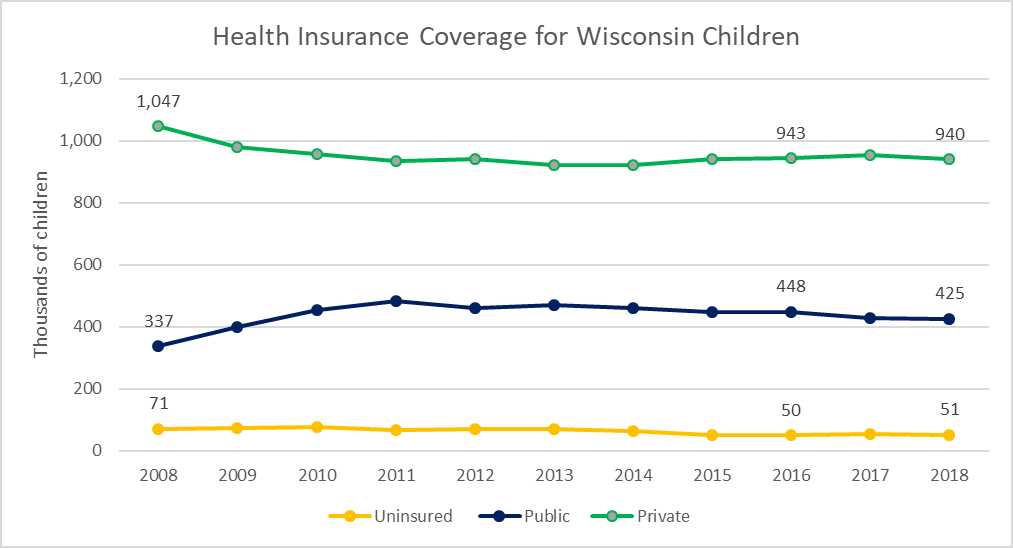
Health Insurance Coverage for Wisconsin Children
Recently the New York Times published an article about the loss of children’s health insurance between 2016 and 2018. The article pointed out that the increase in uninsured children is concentrated in a relatively few number of states. The map below, based on the Times’ data, shows the 14 states with the greatest declines in the average percentage of children with insurance. (According to the Times’ calculation, West Virginia had a 1.1 percent decline and Florida a 1.0 percent decline in their children’s insured rates.)
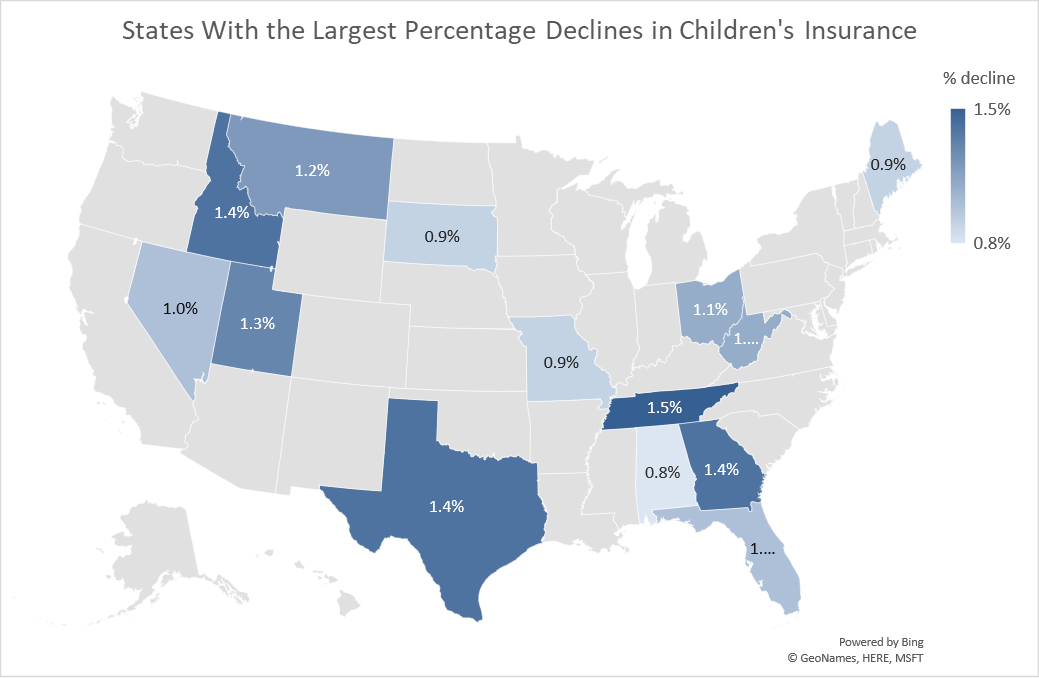
States With the Largest Percentage Declines in Children’s Insurance
Those who follow the politics of health care will recognize that list includes states that have shown especial hostility to expanding health care coverage. For example, only 5 of these 14 states have implemented the Medicaid expansion offered by the law, compared to 34 of all 51 states (counting Washington, DC).
One limitation on the use of Census data is timing. It takes a while for Census to compile that data. Thus, the results for 2018 were issued in Fall 2019. One way to get an earlier read on enrollment is to use data on Medicaid/CHIP enrollment collected by the federal Centers for Medicare and Medicaid, which have released enrollment data for the first half of 2019.
Starting with the government data (and adding missing states), the Georgetown University Health Policy Institute reports state-by-state enrollment for 2017, 2018, and the first part of 2019. Its conclusion is summarized in the title of its report: Most Recent CMS Data Show Child Enrollment in Medicaid/CHIP Dips Again in June 2019.
The graph below, based on data in this report, compares the numbers of children nationally in these programs. Compared to 2017, enrollments in 2019 are more than one million lower. The decline of 830,000 between 2017 and 2018 is a bit higher than the Census estimate, but not surprising considering that the two numbers come from very different sources.
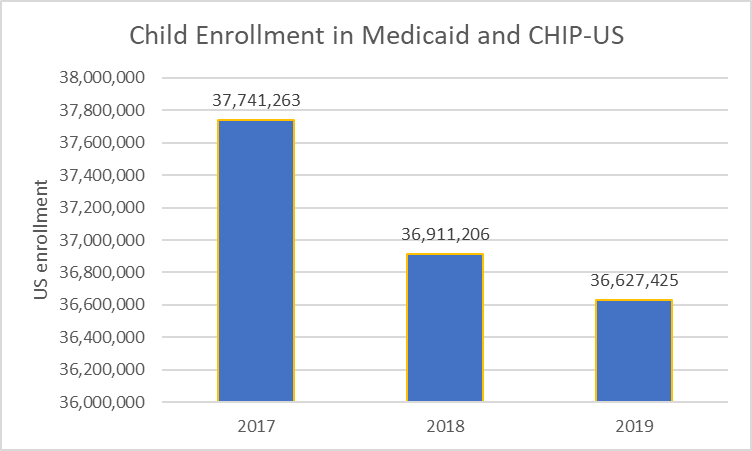
Child Enrollment in Medicaid and CHIP-US
The challenge in interpreting changes in Medicaid is figuring out what is causing the change. A decline in enrollment might reflect a better economy so that children’s parents now qualify for coverage through their employer. Conversely it may reflect state officials tightening regulations in order to knock children off the health care plan.
Not surprisingly, officials in the Trump administrations prefer the first explanation. The Times quotes Seema Verma, the administrator of the Centers for Medicare and Medicaid Services as tweeting: “Unemployment remains low, wage growth is up, & we now see fewer people relying on public assistance. That’s something to celebrate.”
Likewise, in many states with large declines, like Tennessee, Missouri, and Texas, officials cited the stronger job market. The Times article quotes a spokeswoman for the Texas Health and Human Services Commission, as blaming “record-low unemployment levels.”
But, if employer supplied insurance was the cause, one would expect private insurance enrollment and the uninsured rate to decline. At least in 2018, this did not happen.
An alternative explanation is that these states have added barriers that have the effect of reducing enrollments. The Times article offers several examples:
- States like Tennessee and Texas created rules to check the eligibility of families more frequently, which meant that children were dropped when their parents did not respond within the time limits.
- Children were dropped when the states adopted new computer systems.
- In states with large immigrant populations like Florida, there was “growing concern among parents that signing up their children (who are citizens) may hurt their own chances of getting a green card or increase their risk of deportation.”
The graph below shows the enrollment of Wisconsin children in Medicaid. Enrollment shrank 2018, the last year of the Walker administration, but grew in 2019, the first of the Evers administration. At the risk of over-interpreting the data, this is consistent with the notion that enrollments are driven by the attitude of people at the top. Is the prime goal to cover everyone who qualifies—or to make sure the rules are rigorously applied?

Wisconsin Children Enrolled In Medicaid
Given increasing complaints about the difficulty of hiring employees in Wisconsin, it seems unlikely that the explanation for increased Medicaid enrollment is due to families losing insurance through their employers. Unfortunately, we are unlikely to see 2019 enrollment data until next year at this time.
Data Wonk
-
Who Do You Trust to Conduct Elections Fairly?
 Apr 6th, 2026 by Bruce Thompson
-
Is Non-Citizen Voting a Real Threat to Elections in Wisconsin?
Mar 18th, 2026 by Bruce Thompson
-
How Global Climate Change Affects Milwaukee
 Mar 11th, 2026 by Bruce Thompson