Geography Plays Role in Wisconsinites’ Health
UW-Madison researchers have noted disparities in a number of areas across the state’s 72 counties.
Air pollution levels vary quite broadly across Wisconsin, but they follow a clear geographic trend: particulate counts in the southeastern corner of the state are close to double those along its northern border. Population density and accompanying automobile traffic and industry in the Milwaukee and Chicago regions contribute to this difference, which is a distinct example of how geography is a factor in health.
However, most other determinants of health in Wisconsin do not follow a pattern quite so clear this one.
Among nearly three dozen factors that influence health, some places in Wisconsin are doing better than others. Exactly how they fare is explored by the County Health Rankings & Roadmaps. For the past 10 years, this project of the University of Wisconsin-Madison Population Health Institute and Robert Wood Johnson Foundation highlights differences in health, measured at the population level, across Wisconsin’s 72 counties, along with every other county in the United States.
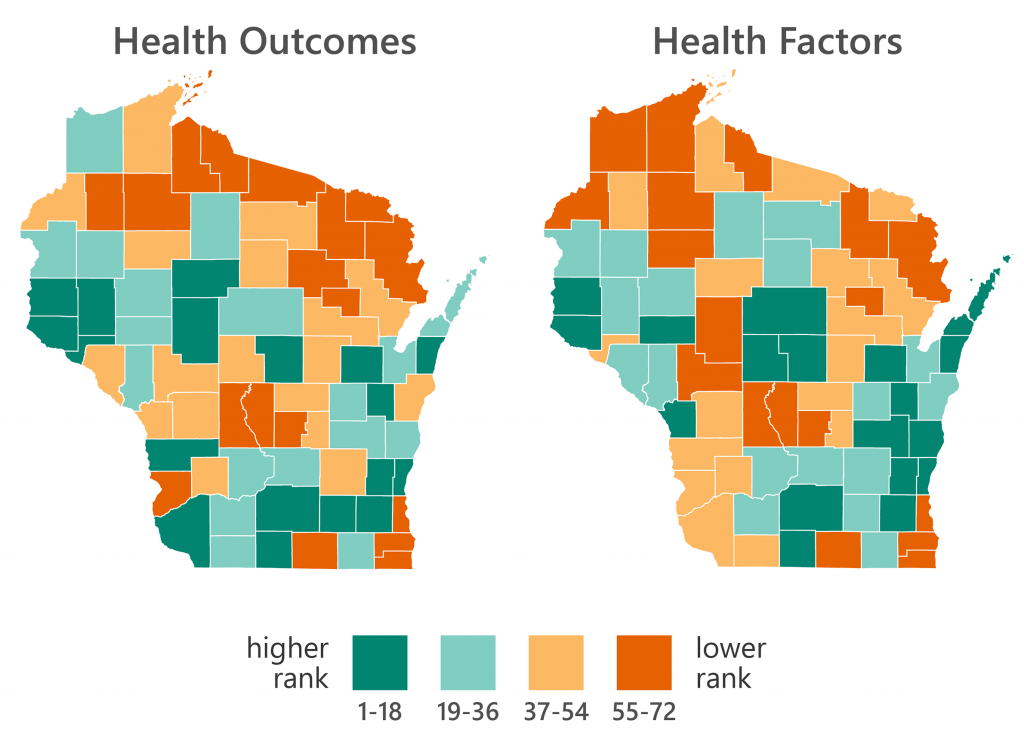
Wisconsin’s 2019 health rankings did not see any dramatic changes compared to 2018, with most counties remaining in approximately the same positions as the year before and earlier in the 2010s.

The 2019 health rankings and outcomes for all 72 Wisconsin counties are compared in side-by-side maps, with data sourced from the County Health Rankings & Roadmaps project.
Some notable patterns persist in terms of those counties doing well — and others that are not.
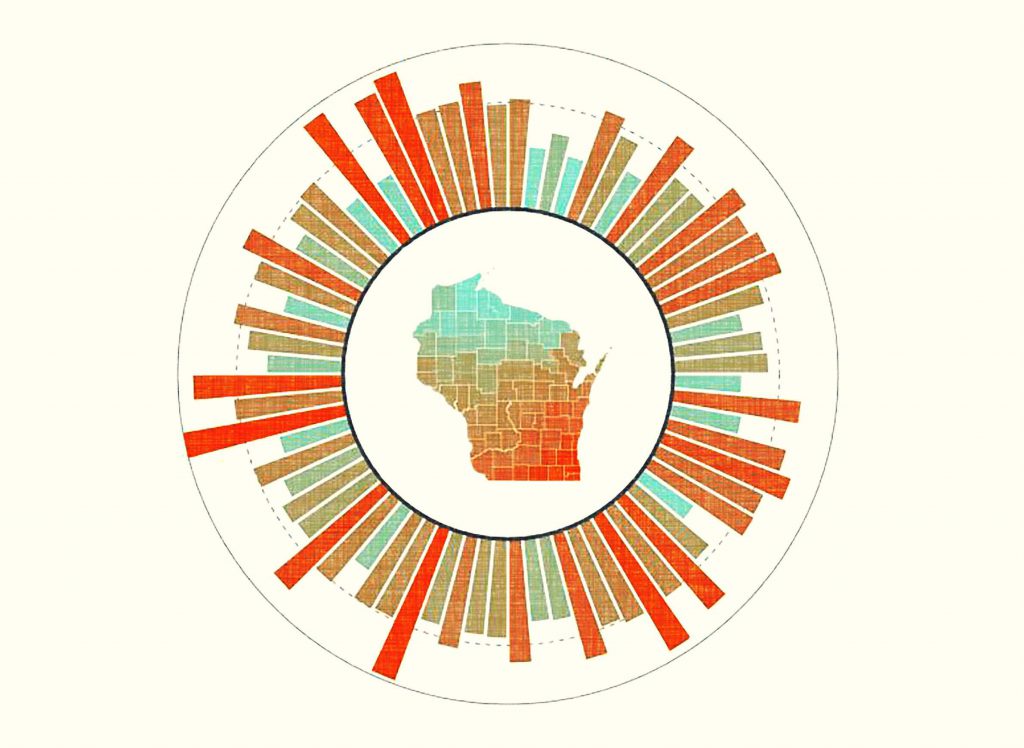
An interactive graphic presents the Rankings & Roadmaps’ county health data in a visual format. Centered on a map and detailed in a circular bar chart, it displays 35 health measures for every county in Wisconsin.
Arranged alphabetically and starting at the top in clockwise order, the chart features an outer circle marking the maximum measure of a given factor, and a dotted line marking the statewide median. A menu at the top of the graphic lists the different health measures included in the rankings, starting with air pollution and ranging from excessive drinking to physical inactivity to severe housing problems.
Menominee County stands out for health risk factors and poor health outcomes across multiple domains. The data show that the county’s residents are at much higher risk for poor health due to multiple social disadvantages that have compounded across generations.
Out of all 72 counties in Wisconsin, Menominee has highest income inequality, housing problems, numbers of children living in poverty and children in single-parent households, as well as the lowest high school graduation rates, access to exercise opportunities and food environment quality. These risks lead to poor health, including outcomes like adult smoking, obesity, poor mental and physical health, poor general health and even premature death.
Menominee is also unique among Wisconsin’s 72 counties for sharing coterminous borders with the Menominee Indian Tribe of Wisconsin. Recognizing local health disparities, the tribe is pursuing efforts to improve the factors that can influence them. Menominee Nation won a 2015 Culture of Health prize from the Robert Wood Johnson Foundation for its work to address historic trauma and contemporary social disadvantage. Graduation rates from Menominee Indian High School have increased dramatically in recent years, and local health officials are shifting to a trauma-informed care model to improve the lives of local residents. These efforts to address the health equity crisis in Menominee County are ongoing.
Highlighting the relationships between social and economic factors, and how influential they are on health, Dane and Ozaukee also have the highest percentages of adults with at least some college education, and Ozaukee has the lowest child poverty rate in the state at just 4.5% (Comparatively, Dane County’s child poverty rate is 9.3%, which is still below the state’s median of 15.3%).
Violent crime in Milwaukee County reflects its position as the largest metro area in the state with a crime rate that is 10 times the median for all other counties (1,020 reports per 100,000 population).
What else stands out? Over 90% of the working people of Florence County drive alone to work each day. Taylor County has the lowest rate of flu vaccination, with just 25% of Medicare enrollees getting the annual shot. And Adams County appears to have a dearth of both dentists and mental health professionals.
As for health insurance, the number of people under age 65 who don’t have it is much higher in Clark County — 18% — compared to the next-highest counties of Menominee, at a 11.2% uninsurance rate, and Vilas at 11%.
Although these health measures are generally very reliable, reading too much into any one individual factor can be problematic. For example, although Adams County has an unusually low number of dentists per capita, the measure does not take into account that many residents could be driving to neighboring communities to access dental services. These locally low rates of health care provider access reflect the issue of long travel distances for health care in rural area.
It’s best to interpret the measures in general terms. They may be used by public health departments and policymakers to help identify trends and problem areas, and anticipate those that need to be addressed as new needs arise.
Editor’s note: This item is updated to clarify health outcomes in Menominee County.
35 Health Measures Illustrate Disparities Across Wisconsin In 2019 was originally published on WisContext which produced the article in a partnership between Wisconsin Public Radio and Wisconsin Public Television.


