
What State School Report Cards Tell Us
Measuring charter and choice schools against MPS is revealing.
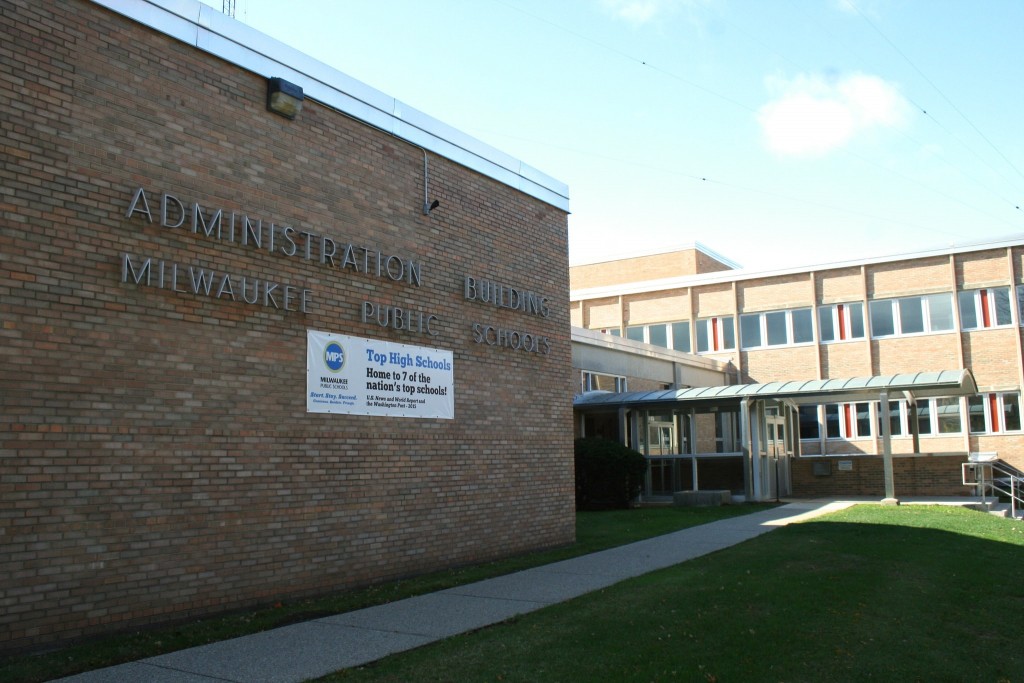
The MPS Central Office building, 5225 W. Vliet St. Photo by Jabril Faraj.
Recently the Wisconsin Department of Public Instruction (DPI) posted its School Report Cards for the 2017-18 year.
For most schools, if enough data are available, DPI calculates an Overall Accountability Score. This score is based on four priority areas: student achievement, growth, closing gaps and on-track and post-secondary success. Depending on its score, the school is given one of five ratings: fails to meet expectations, meets few expectations, meets expectations, exceeds expectations, or significantly exceeds expectations.
The chart below shows the results for all schools located in the city of Milwaukee. This includes regular MPS public schools in yellow, charter schools in blue, and private schools in the Milwaukee Parental Choice program in red and purple.
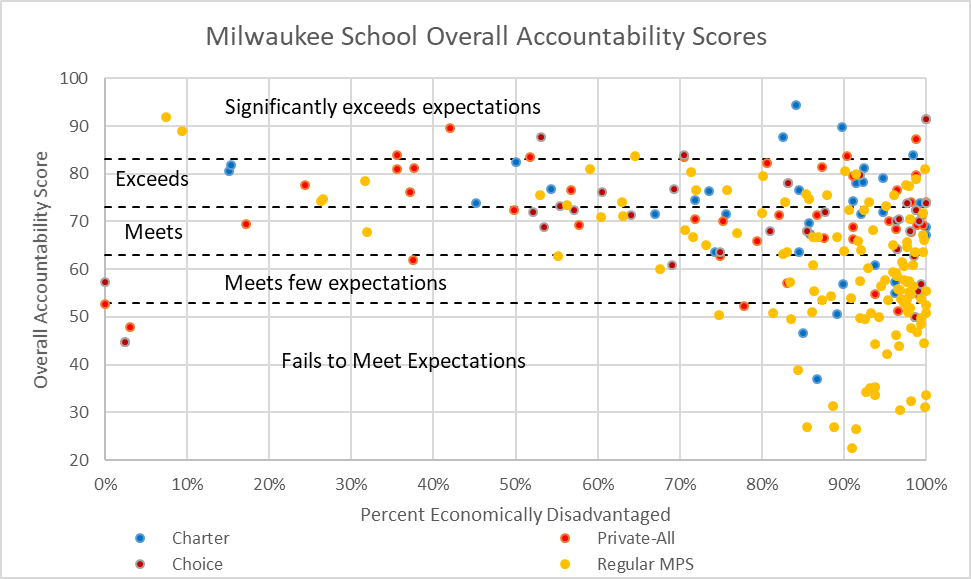
Milwaukee School Overall Accountability Scores
The vertical axis shows schools’ overall accountability scores. The horizontal axis shows the percentage of students classified as economically disadvantaged, generally measured by the percentage qualifying for the free lunch program.
DPI allows private schools participating in the School Choice program to either report data for all their students or for only those students participating in the program. Some Choice schools report data both ways. Somewhat surprisingly, their way of reporting does not seem to have a major effect on the result. Rather than find a way to combine the two ways of reporting, I chose to report Choice school results both ways, which means that some schools appear twice. Conversely, some smaller Choice schools don’t appear because their small enrollment means there is insufficient data to produce a score.
The average score of Milwaukee charter schools is 70.5 which is at the high end of the “meets expectations” ratings. This is consistent with my previous discussion of results on the Wisconsin Forward exam. That story noted that Milwaukee Excellence Charter School, the charter school recently established over the opposition of several school board members, received the highest score of any school in Milwaukee.
The average scores for schools in the Choice program (69.8 for schools reporting results for all their students, 68.3 for Choice students only) fell just slightly below that for charter schools. This surprised me, considering the number of really bad Choice schools that have had to be closed by the DPI. Perhaps we are seeing the combined effect of DPI’s regulations and a market effect as families select more successful schools.On average, regular MPS schools fall well below both charter and Choice schools with an average score of 59.4, putting them in the “meets few expectations” range. However, those schools also have the largest variation in results.
Schools with poverty rates under 80 percent tend to get up into at least the “meets expectations” range, whether charter, choice, or regular MPS. Having schools that attract middle class families is important for the future of Milwaukee, both for its economic viability and, in the long run, to reduce the segregation between Milwaukee and its suburbs. In my own neighborhood on the East Side, for instance, the conversion of the Maryland Avenue School to Montessori programming has served to attract a diverse group of families to its attendance area.
The bigger challenge for Milwaukee schools is educating children in poverty, reflecting the concentration of poverty in the city. The next chart shows outcomes for schools whose poverty rates exceed 80 percent. Perhaps the most notable take-away is the predominance of regular MPS schools among the schools that “fail to meet expectations.” This includes all MPS high schools lacking admissions requirements. Educating children in poverty is very challenging. However, also notable in the chart is the number of schools that appear to be meeting this challenge.
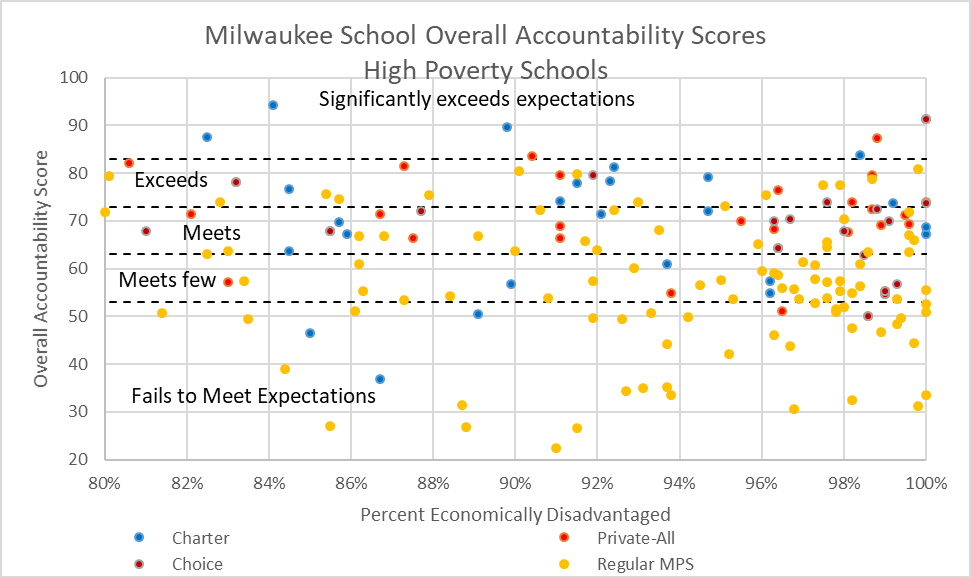
Milwaukee School Overall Accountability Scores High Poverty Schools
Two of the measures used by DPI to generate the Overall School Score are growth in English language arts (ELA) and mathematics. To calculate these, student scores on one year’s exam are compared to the same students’ scores the previous year. These measures reduce the advantage enjoyed by a school whose students enter well-prepared. It comes closer than raw test scores to reflecting the school’s contribution.
The next graph shows ELA growth for Milwaukee schools. The highest possible score is 50. Because only tenth grade is tested in high schools, no high school is included. Again, note the huge variability in student growth among high-poverty schools, particularly among the regular MPS schools.
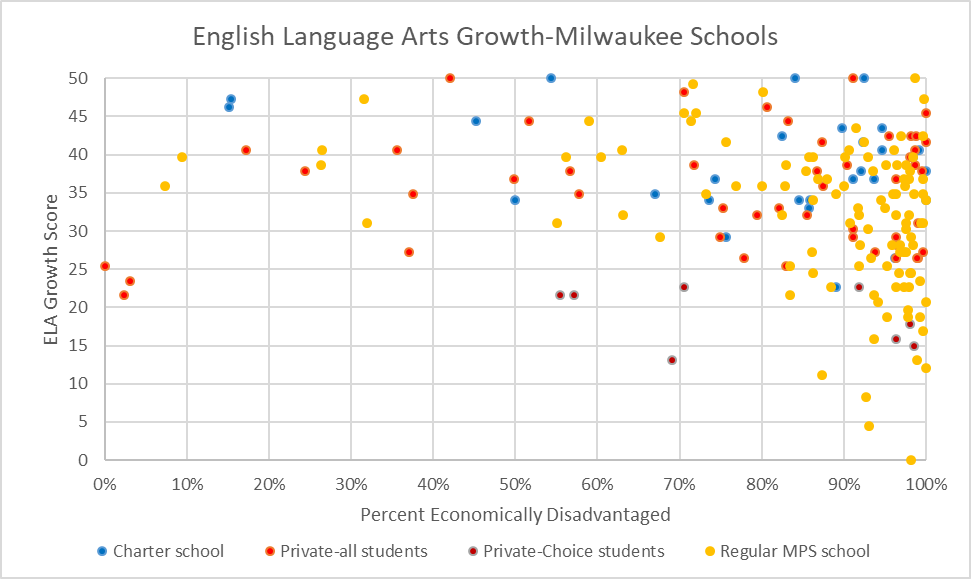
English Language Arts Growth-Milwaukee Schools
The next chart shows school growth in mathematics. Again, as poverty increases, the variability of results also increases.

Mathematics Growth-Milwaukee Schools
The next graph compares growth in mathematics to growth in English Language Arts. On the whole, schools that do better on one do better on the other, but the relationship is not a powerful one.
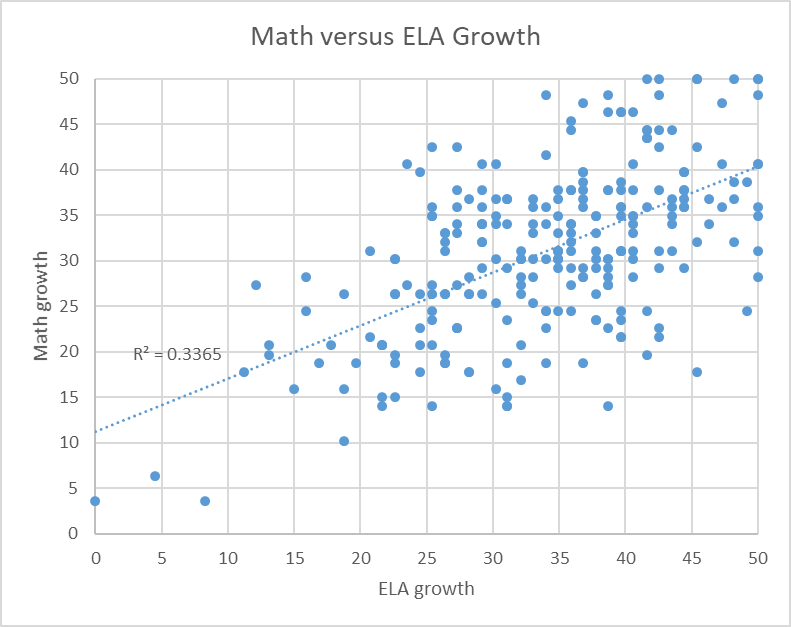
Math versus ELA Growth
It is no surprise that Milwaukee’s big challenge is to effectively educate large numbers of children living in poverty. The bad news is that the community is not doing this effectively or consistently. However, contained in this inconsistency is the good news: a substantial number of Milwaukee schools—whether charter, choice, and regular MPS—appear to have figured out how to educate students despite their families’ economic challenges.
This has the potential to turn challenge into opportunity: Milwaukee, if only it had the will, has all the pieces needed to become the experts on educating children in poverty. If successful, the next generation will have the tools allowing them to escape their family’s poverty.
However, there are obstacles. Too many adults associated with MPS—and this includes the MTEA (teachers’ union)—put their economic interest first. Rather than concentrating on finding ways to make MPS schools more effective, and more competitive, they act like classical monopolists by trying to limit the ability of Milwaukee students and families to choose charter schools and private schools.
A second obstacle is the tendency in education to start with theory and defend that theory tenaciously against contrary evidence, rather than look critically at the evidence of what works and what does not. A number of the Data Wonk columns have looked at the myths of the right, ranging from bad decisions based on the supply-side economics theory to the refusal to accept human-caused climate change. Education demonstrates that the left is not immune to the instinct to reject inconvenient truths.
Data Wonk
-
Who Do You Trust to Conduct Elections Fairly?
 Apr 6th, 2026 by Bruce Thompson
-
Is Non-Citizen Voting a Real Threat to Elections in Wisconsin?
Mar 18th, 2026 by Bruce Thompson
-
How Global Climate Change Affects Milwaukee
 Mar 11th, 2026 by Bruce Thompson


Thank you, Mr. Thompson, for an insightful and practical analysis. It’s good to see the 8 high poverty schools doing so well. Having said that, so much State government policy is working against our community’s educational progress, by fostering more challenges to escaping poverty. I hope Governor Evers can reverse some of the damage, starting with Medicaid expansion and enabling City government to improve housing conditions.
Best wishes, Mark Nicolini
I respect Bruce Thompson a great deal, but this topic is his weak point. Comparing schools based on test scores, even when the percentage of students classified as Economically Disadvantaged (ED) is taken into account, does not show very much. The ED classification is too broad. There are HUGE differences within that category. Some students are in very deep poverty, have severely traumatic home circumstances and/or are even homeless. The ED measure takes none of this variability into account.
More importantly, even assuming all things are equal socioeconomically, choice and charter schools can cherry pick the students they teach. Ample research has shown that they can and do put up barriers to enrollment for the most challenging students. Stories are legion of students being counseled out after the 3rd Friday count in September and after the 2nd Friday count in January. Students in the schools do not have the same due process protections as students in public schools. Only the public schools are truly obligated to take all the students. Thompson’s look at data and test score does not account for the fact that public schools teach different students than voucher and charter schools.
A better approach would be to look at the components of a quality school, such as the experience and education level of the teachers. Again, ample research shows this factor is closely linked to quality education. On this measure public schools are vastly superior to charter and voucher schools which take a low-road labor strategy of low paid, high turnover teaching forces.
I would concur with Mark Nicolini’s excellent commentary on this article. I wish Mr. Thompson would go through his research and come up with what he finds as the “best practices” of schools that are making a real impact in schools with high levels of family poverty. There are too many “programs” implemented by various school entities that failed yet continued without the needed scrutiny that MPS has had over the decades of school reform initiatives since the early 1990s.