
Three Visions of the Future
Comparing the Trump, Clinton and Ryan tax plans and their impact on the economy.

Hillary Clinton, Donald Trump and Paul Ryan.
Both candidates for the presidency—Donald Trump and Hillary Clinton–have issued plans to reshape the American tax system–in the case of Trump, a series of plans. Reflecting disarray on the Republican side, Congressman Paul Ryan and the Republican members of the US House of Representatives have proposed their own plan which differs substantially from that of their presidential nominee.
There are striking differences between the Trump and Ryan tax plans. A post from the Tax Policy Center found the contrasts between the Ryan plan and an earlier version of Trump’s plan are “so strong that it is hard to imagine how candidates sharing the same ticket can square them.”
Economists distinguish between “positive economics”—trying to understand how things work—and “normative economics”—judging whether a particular outcome is good or bad. Theoretically one’s political views should not intrude when doing positive economics; in practice, separating the two is easier said than done. An economist who finds Ryan’s division of Americans into “makers and takers” attractive is also likely to conclude that reducing taxes on the wealthy will bring prosperity.A recent example of a statement that purports to be descriptive but is really political is a recent “Statement by Economists Concerned by Hillary Clinton’s Economic Agenda.” By limiting signatures to people who can claim to be economists, it hopes to gain extra credibility, but it is simply a reflection of the political preferences of its authors and signers.
Candidates’ tax plans offer insight into the values and priorities of the sponsors—in some ways more meaningful than the typical campaign slogan or talking point. It’s one thing to talk about “making America great again” or being “stronger together,” but what are the dollar figures behind each vision?
Impact on federal revenues and the deficit
Since the beginning of the Obama administration, in the midst of the Great Recession, Republicans have expressed great concern about federal budget deficits. Wisconsin’s Senator Ron Johnson is known for his PowerPoint presentation raising such alarms. It is striking, then, that both the Trump and Ryan plans propose substantial increases in the deficit, in trillions of dollars.
Both the Tax Policy Center, joint project of the Brookings Institution and the Urban Institute, and the Tax Foundation–which generally champions reductions in marginal tax rates–have analyzed all three proposals. Their conclusions are summarized in the chart below. (To see the full TPC reports, click on one of the following links: Trump, Ryan, and Clinton.)
These results are called “static” models since they don’t take account of potential changes in economic activity due to the plans. Both the groups publish 10-year projections of revenue increases or decreases, allowing a comparison between the three plans. Because none of the plans fills in all its details, analysts have to make various assumptions, helping explain the differences in the estimates from the two groups.
The Tax Policy Center and Tax Foundation agree that both Republican plans would increase the federal deficit. The Tax Policy Center projects the Trump plan to add $6.2 trillion over the first decade, not counting added interest costs needed to finance this deficit. The Tax Foundation puts the Trump deficit increase between $5.9 trillion and $4.4 trillion over the next decade. Paul Ryan’s House Republican tax plan is also estimated to increase the deficit, at about half the rate of Trump’s.
By contrast, the Clinton plan is designed to pay for itself, by increasing taxes on the wealthiest Americans and actually runs a surplus, both groups find. The additional revenue would be used both for slightly reducing taxes on the bottom 80 percent of Americans and funding additional programs.
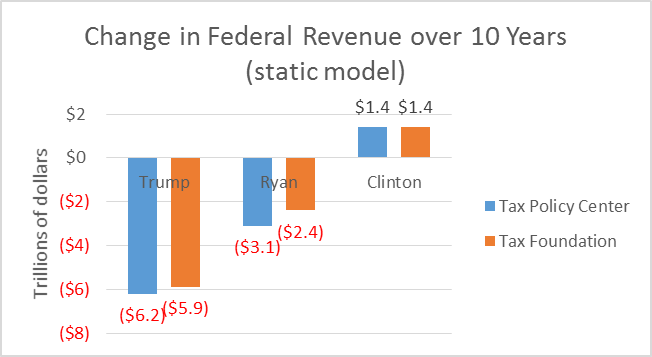
Change in Federal Revnue over 10 Years (static model)
Who benefits from the proposals?
Despite the differences in their details, both GOP plans are heavily skewed towards benefiting high earners. The chart below shows the estimated change in after-tax income resulting from the three plans for those making different, according to the Tax Policy Center’s analyses. In the chart the highest 20 percent of earners are subdivided into 4 parts.

Change in After Tax Income
The next chart analyzes the distribution of the benefits for the Trump plan. The top 5 percent of earners enjoy 64 percent of the benefits.
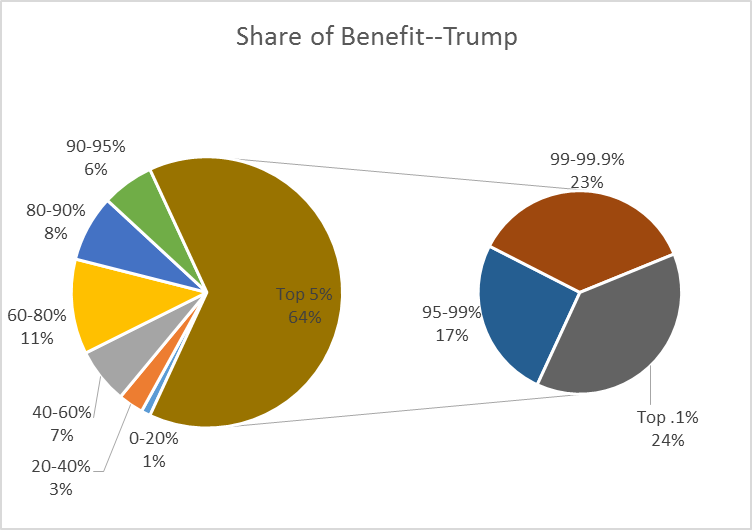
Share of Benefit–Trump
Ryan’s plan is even more top-heavy. As the next chart shows, the top 5 percent of earners get 89 percent of the benefit.

Share of Benefit–House GOP
In Clinton’s plan, taxes on the wealthiest (top 20 percent of the population) would be increased. The resulting revenue would be used for two purposes: a small tax reduction in taxes on the bottom 80 percent of the population and paying for additional programs she proposes.

Clinton Plan–Who Benefits and Clinton Plan–Who Pays
In the debates between Trump and Clinton, several times Trump has charged that Clinton proposes to benefit her wealthy supports, specifically naming Warren Buffett and George Soros. This is among the odder of Trump’s claims. If self-interest was driving Buffett and Soros, they should be lining up behind the Ryan and Trump tax proposals, not Clinton’s.
Effect on the economy
While making the tax system more regressive at a time when there is growing concern about economic inequality may seem an odd policy choice, supporters of the Trump and Ryan plans argue the decrease in taxes will lead to greater economic activity. Conservative advocacy organizations, such as the Tax Foundation and the Heritage Foundation, offer models showing greater economic activity from the Trump and Ryan proposals.
Less partisan sources have found other results. The chart below shows projections from Moody’s Analytics using its model of the economy, assuming the full Clinton and Trump proposals were enacted. Although near-term the Trump tax cuts would give a small boost to the economy; in the long run the economy would be driven downward. By contrast, Clinton’s proposal would result in a slight economic boost, in both the short and long terms.
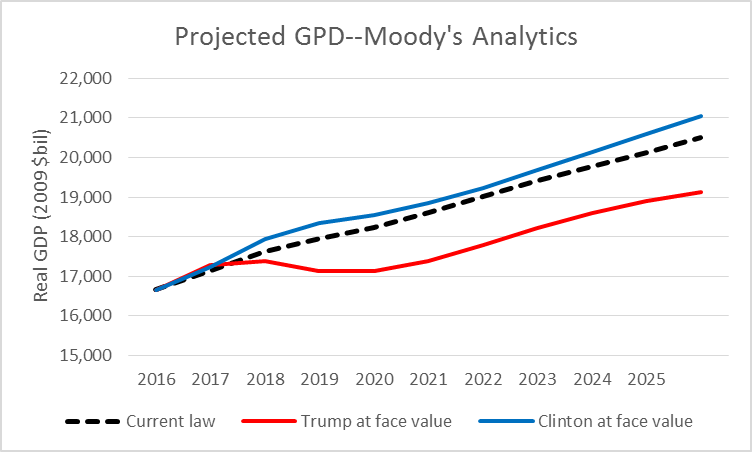
Projected GDP–Moody’s Analytics
Several factors contribute to the poor performance of the Trump proposals in the Moody model. A big factor is “crowding out”: with large deficits the federal government’s need to borrow soaks up available credit, leaving less room for private investment. This becomes more of an issue as the economy recovers from the recession. Other parts of Trump’s plan also contribute to poor performance, including restrictions on immigrants, thus restricting labor supply, and restrictions on international trade.
Another analysis comes from the Penn Warton model. As the chart below demonstrates, this model also shows the Trump proposals depress the economy, as do the Ryan proposals, but to a lesser extent. While the long-term result of the Trump plan is similar to that predicted by the Moody model, it takes place over a much longer period. Clinton’s proposal essentially keeps the economy at even keel.
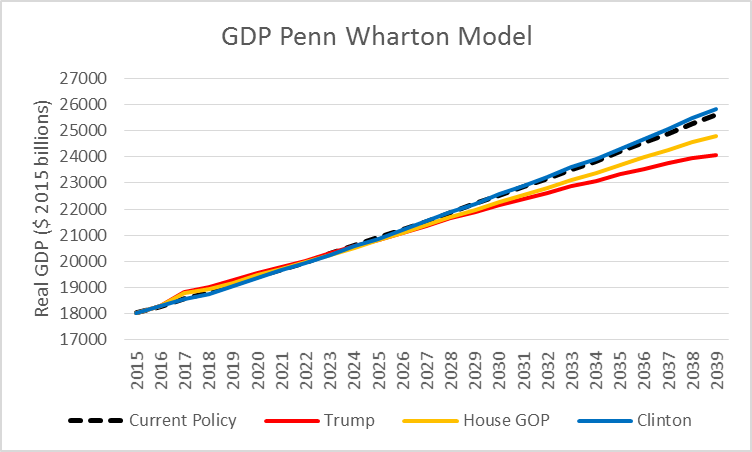
GDP Penn Wharton Model
The main driver of the poor performance by the Trump plan in this model seems to be the crowding out issue. The model’s website has sliders that allows the user to change various factors. The default sets the limit on foreign investment to 40 percent. If instead it is set to 100 percent, Trump’s plan performs about as well as the others.
A recent post from the Tax Foundation took note of this phenomenon, arguing that deficits may no longer matter because of the increased willingness of foreigners to supply any shortage of investment funds.
Does “Dynamic Scoring” Change Results?
Supporters of the Trump and Ryan plans argue that cost analyses such as those prepared by the Tax Policy Center overstate the effect on the deficit because they don’t take account of the increased economic activity that tax reductions create. This increased activity would lead to more tax collections, reducing lost federal revenues.
This leads to so-called “dynamic” scoring, as opposed to the “static” scoring practiced by the Tax Policy Center. Using its model the Tax Foundation reduces the ten-year cost of the Trump plan from $5.9 billion to $3.9 billion. The dynamic cost of the Ryan plan almost disappears.
Of course dynamic scoring improves the picture only if the plan leads to a more vigorous economy. As already discussed both the Moody and Penn-Wharton models project decreased economic activity under the Trump plan. It is no surprise, then, that dynamic scoring is not helpful to either the Trump or Ryan plans, as reflected in the chart below. It does show a positive impact from Clinton’s plan.
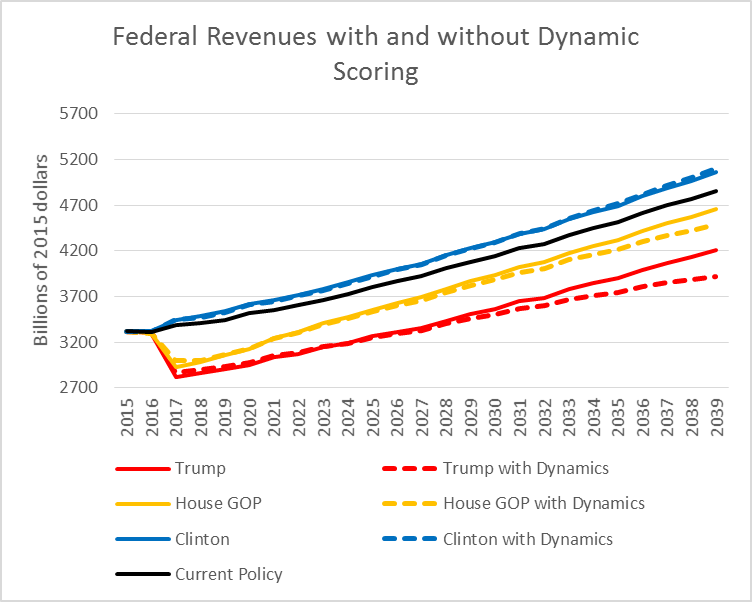
Federal Revenues with and without Dynamic Scoring
There are essentially two ways to look at economic policies. One is to look at what economic theory predicts. By incorporating economic theory into their models, the Moody and Penn-Wharton models allow one to compare the Democratic and Republican proposals.
A second approach is to look at the historical record. Has the economy improved when tax rates—particularly the top rates—has been lowered? But that is a topic for a future column.
Data Wonk
-
Who Do You Trust to Conduct Elections Fairly?
 Apr 6th, 2026 by Bruce Thompson
-
Is Non-Citizen Voting a Real Threat to Elections in Wisconsin?
Mar 18th, 2026 by Bruce Thompson
-
How Global Climate Change Affects Milwaukee
 Mar 11th, 2026 by Bruce Thompson


A thoughtful, reasoned analysis of the various tax/budget plans. Good work, Bruce.
Amen to what Dennis G says in post # 1. My eyes read these charts as validation that Hillary has thoughtfully considered the consequences of tax and budget policies. Trump looks like he is winging it on this matter. Ryan appears to be stuck on an economic model that may have worked for his ancestors – a model that still works for him, personally, but one which offers little promise for those without substantial inherited wealth or investment income.