The Ecological Deficit of Great Lakes States
They use more resources than they renew. Wisconsin is worse than 25 states
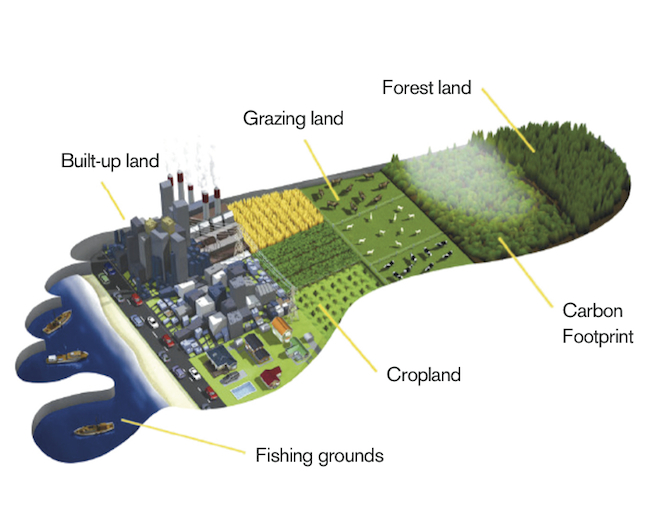
Global Footprint Network measures a population’s demand for and ecosystems’ supply of resources and services. Image: Global Footprint Network
The nation hit Ecological Deficit Day recently, thanks in part to the Great Lakes states that use more resources than they regenerate.
A report by the California-based Global Footprint Network and the Tacoma, Washington, nonprofit group Earth Economics details the resource availability and the environmental footprint of all 50 states. That footprint includes the unsustainable practices that broke the Great Lakes states’ ecological budget.
Ecological Deficit Day was July 14, the date when the U.S. was no longer living within the means of its own natural resources – or ecological budget – for the year. It’s not just the fault of Great Lakes states. In fact, only 16 states can boast that they use fewer resources than they renew each year.
“Not everyone’s in the same boat,” said Mathis Wackernagel, sustainability advocate and Global Footprint Network president. “It’s not a problem, but a global storm with many local boats occupying many local situations. We should be asking if our own boats are ready.”
Sustainability means “recognizing there’s a significant budget constraint, the fact that there’s only one planet,” he said.
The groups measured the states’ ecological footprint – a measure of land and water needed by its residents to produce and consume resources and to absorb their waste. They also measured the ability of those states to provide the resources, called biocapacity. And they factored in how much globe-warming carbon they produce.
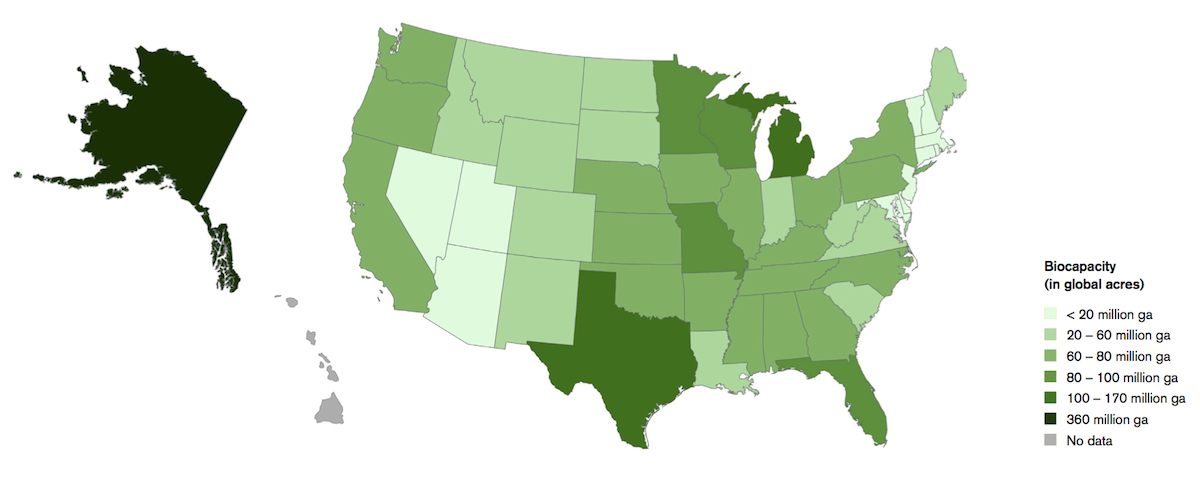
Biocapacity varies widely by state. Darker colored states have more bipcapacity. Image: Global Footprint Network
It’s complicated stuff. A separate report describes the methodology and background of the terms and statistics that they used. The deficit is measured in global acres – acres that are adjusted according to the world average for resource productivity in cropland, forests and fishing areas.
The Global Footprint Network intends to use the data to help cities and states measure their natural capital, identifying deficits, challenges and opportunities to improve their use of resources.
“We want to motivate institutions at the state and federal level to consider their capacity, how many slices of the United States pie they consume or contribute,” Wackernagel said.
Wackernagel also asks states to consider the impact of long commutes and large families – how states build their cities, how they power their homes, and how they can continue providing resources to the “local boats” of each state.
States fair better when their biocapacity is high and their ecological footprint is low. A high biocapacity may be related to a state’s ability to regrow trees or absorb carbon emissions. A low ecological footprint may mean that a state efficiently consumes its resources but it also may simply be related to a low population.
“The most limiting factor is the premise that our resource dependence isn’t as high as it is,” Wackernagel said. “Even for fossil fuels, the limiting factor is not what exists underground, but the ability to reabsorb what is burned.”
Echo pulled the information from the report and ranked the Great Lakes states by how close they landed to breaking even at providing and consuming resources.
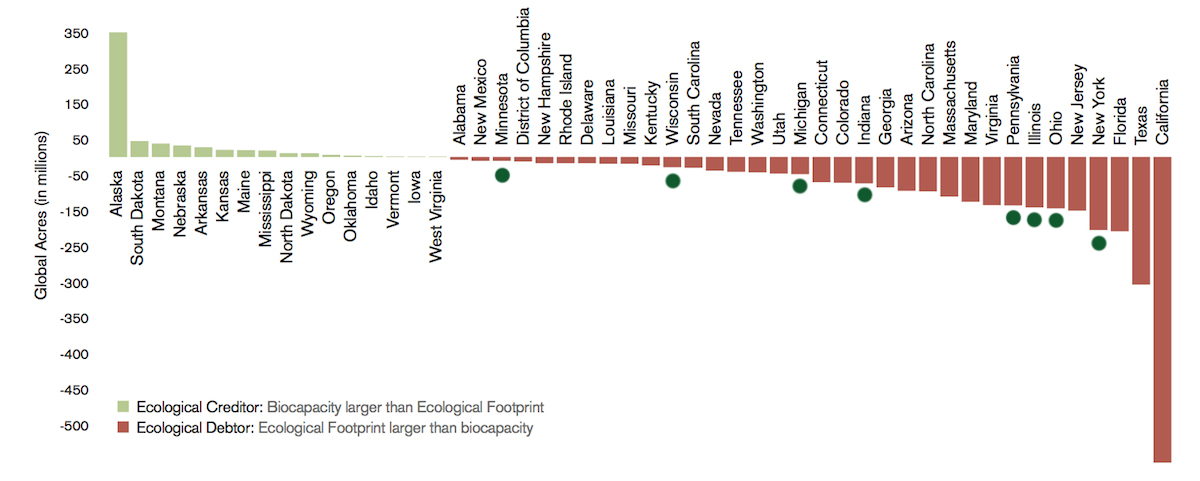
All eight Great Lakes states (dotted in green) are ‘ecological debtors,’ containing a higher ecological footprint than biocapacity. Image: Global Footprint Network
Minnesota (No. 1)
Minnesota is the closest Great Lakes state to breaking even – having an ecological footprint equal to the states’ biocapacity.
But its high biocapacity (No. 1 in Great Lakes, No. 18 in nation) is still not enough to match it’s resource use, or ecological footprint (No. 6 in Great Lakes, No. 31 in nation) putting the state in debt over 10 million global acres.
While in debt to the environment, Minnesota is on a cleaner path, generating up to 20 percent of electricity using renewables, primarily through wind (see below).
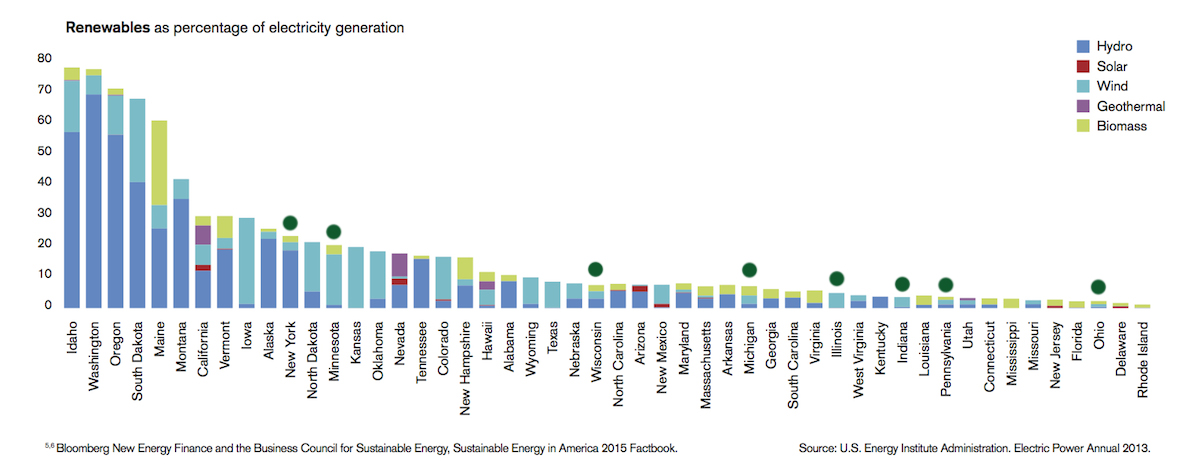
Renewables as percentage of electricity generation by state (Great Lakes states dotted in green). Image: Global Footprint Network
Wisconsin (No. 2)
Despite having the worst eco-footprint (No. 8 in Great Lakes, No. 37 in nation) in the region, Wisconsin has a relatively high capacity (No. 2 in Great Lakes, No. 21 in nation) to regenerate its resources.
Wisconsin is in debt 29 million global acres, three million more than Ontario, Canada.
Michigan (No. 3)
Among the top three states for resource abundance, Michigan’s use of natural resources (eco-footprint; No. 3 in Great Lakes, No. 15 in nation) still outweighs its ability to regenerate them (biocapacity; No. 3 in Great Lakes, No. 25 in nation). Its ecological debt is over 47 million global acres.
Indiana (No. 4)
The less resource abundant Indiana follows the Great Lakes trend with low capacity to generate resources (No. 4 in Great Lakes, No. 31 in nation) and high use of them (No. 7 in Great Lakes, No. 32 in nation).
Indiana also racked up almost 74 million global acres in ecological debt.
Pennsylvania (No. 5)
Pennsylvania is in a three-way tie with the sixth lowest ecological footprint in the nation (No. 2 in Great Lakes, No. 6 in nation), despite its ecological debt of about 138 million global acres.
Unsurprisingly, this means its eco-footprint measures larger than its biological capacity (No. 7 in Great Lakes, No. 39 in nation).
But not all is lost.
The report highlights opportunities for natural capital in Pennsylvania’s Lancaster County, the number one non-irrigated county in the nation for crop production. It makes up more than 65 percent of the state’s farmland.
Earth Economics estimates the natural capital provided by farmland preservation in Lancaster County provides $676 million in annual economic benefits.
Illinois (No. 6)
Illinois matches the national average for the ecological footprint of 17.2 global acres per person (No. 4 in Great Lakes, No. 21 in nation) but still has a long way to overcome its ecological debt of 145 million global acres.
It’s low biocapacity (No. 5 in Great Lakes, No. 35 in nation) and exclusive reliance on wind for electric renewables means Illinois has a lot of ground to make up to even consider breaking even, according to the report.
Ohio (No. 7)
Ohio shares a similar ecological debt as Illinois – 148 million global acres – but it has a higher footprint (No. 5 in Great Lakes, No. 27 in nation) and lower capacity for resource renewal (No. 6 in Great Lakes, No. 37 in nation).
It’s also the least productive Great Lakes state in renewable sources for electricity – ranked 48 overall.
New York (No. 8)
New York has the smallest ecological footprint in the nation. But that’s offset by having the third highest population in the nation. With an eco-footprint (No. 1 in Great Lakes, No. 1 in nation) larger than its capacity (No. 8 in Great Lakes, No. 42 in nation), The Empire State is in debt over 207 million global acres.
Densely populated cities give New York the lowest ecological footprint of the Great Lakes states – 14.2 global acres per person. For example, New York City’s dense downtown increases the use of public transit and limits the space available for homes.
As a result, New York’s carbon footprint is nearly half that of Virginia, the state with the largest ecological footprint (see below).
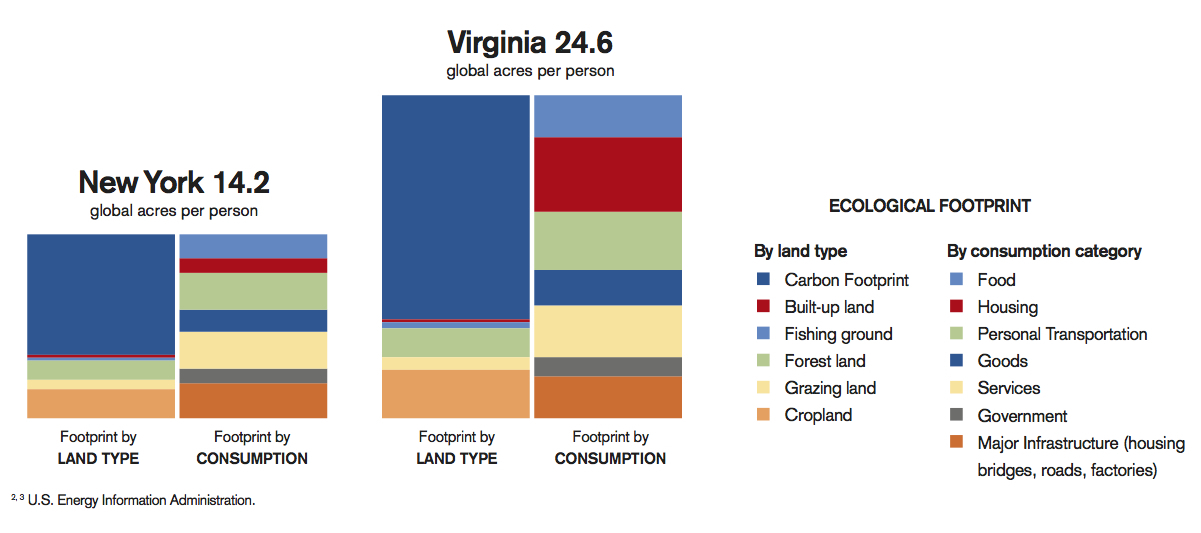
Comparing New York, the state with the lowest Ecological Footprint per capita, and Virginia, the state with the highest. Image: Global Footprint Network
To calculate your own ecological footprint, visit the Footprint Calculator. Great Lakes data selected from the report is presented below. All measurements are in global acres per person unless noted.
| State/Province | Population (millions) | Carbon Footprint | Ecological Footprint | Biocapacity | Biocapacity Deficit |
|---|---|---|---|---|---|
| U.S. | 310,384,000 | 11.5 | 17.2 | 9.3 | 7.9 |
| Canada | 34,490,000 | 9.2 | 16.3 | 36.1 | N/A |
| Minnesota | 5,303,925 | 12.4 | 18.8 | 16.9 | 1.9 |
| Ontario | 13,100,000 | 8.6 | 15.8 | 13.8 | 2.0 |
| Wisconsin | 5,686,986 | 12.9 | 19.2 | 14.1 | 5.1 |
| Michigan | 9,883,640 | 11.2 | 16.6 | 11.8 | 4.8 |
| Indiana | 6,483,802 | 13.1 | 19.1 | 7.7 | 11.4 |
| Pennsylvania | 12,702,379 | 10.4 | 15.8 | 4.9 | 10.9 |
| Illinois | 12,830,632 | 11.3 | 17.2 | 5.9 | 11.3 |
| Ohio | 11,536,504 | 12.4 | 18.3 | 5.5 | 12.8 |
| New York | 19,378,102 | 9.3 | 14.2 | 3.5 | 10.7 |
This story was originally published by Great Lakes Echo.
Great Lakes Echo
-
Tracking Balloon Debris in Great Lakes
 Dec 3rd, 2019 by Tasia Bass Cont
-
Coal Ash Pollutes Midwest States
 Jun 5th, 2019 by Andrew Blok
-
Extreme Changes Forecast for Great Lakes
 May 21st, 2019 by Cassidy Hough