Should State Look Beyond Manufacturing?
Rustbelt jobs have steadily declined since 1990. State should look elsewhere for answers.

Manufacturing
Like coal in West Virginia and Kentucky, manufacturing has taken on mythic importance in the states along the Great Lakes. Does this manufacturing-centric planning get in the way of encouraging the growth of other kinds of jobs? Let’s start with a look at manufacturing jobs and output since the end of the Great Depression.
The blue line in the chart below shows the number (in thousands) of US manufacturing jobs since 1939, as compiled by the Bureau of Labor Statistics. The orange bars show recessions.
Jobs peaked in the Carter administration, the late 1970s. They remained roughly constant for the rest of the 20th Century. The George W. Bush administration was bookended by two recessions, including the devastating Great Recession. While relatively mild, the first of these recessions devastated manufacturing, as did the Great Recession. Since the end of the Great Recession manufacturing jobs have grown slightly since, to a bit more than 12.4 million, well short of the 17 million jobs at the beginning of the new century.
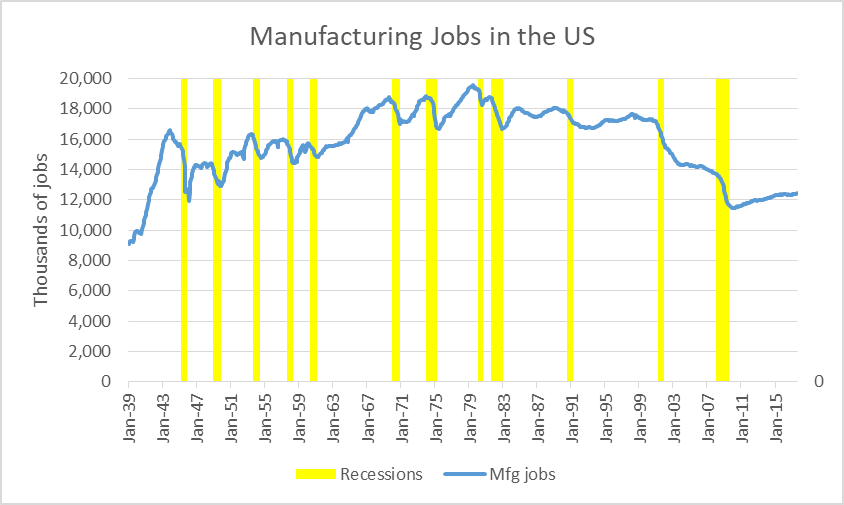
Manufacturing Jobs in the US
The next chart shows the Federal Reserve System’s Industrial Production Index over the same period. Throughout the period, production rose much faster than employment, reflecting increasing productivity. This becomes most evident in the last twenty years of the 20th Century, when employment declined slightly even as production continued to increase.

Production Index
Generally, economists consider increased productivity, the ratio of output to workers, a good thing, at least for the overall economy. It underlies the long-continuing improvement in the American standard of living. For the worker no longer needed, however, it can lead to misery if another job is not available.
Historically recessions have caused both output and employment to dip. Following each recession, output would resume its historic growth trend. Before 1980 employment would grow slightly; afterwards it would shrink slightly.
This pattern was broken with the new century. The recession at the beginning of the century was relatively mild in terms of output, but resulted in the loss of about 3 million production jobs. The subsequent financial recovery was not reflected in a production jobs recovery.
The Great Recession was devastating to both manufacturing output and jobs. In terms of manufacturing job loss, however, it was no worse than the earlier recession. Yet it seems to have fundamentally changed the ease of getting a job.
The next chart shows the average duration of jobs. Not surprisingly, finding a job takes longer during and after a recession, gradually shrinking as the economy improves. The recovery since the Great Recession shows the same pattern, but the time needed to find a job has grown substantially longer. Even with the economic recovery, the average time to come up with a job is longer than it was at the height of any previous recession. The day when a high school graduate could call Human Resources at the local factory and be invited to start work the following Monday is long gone.
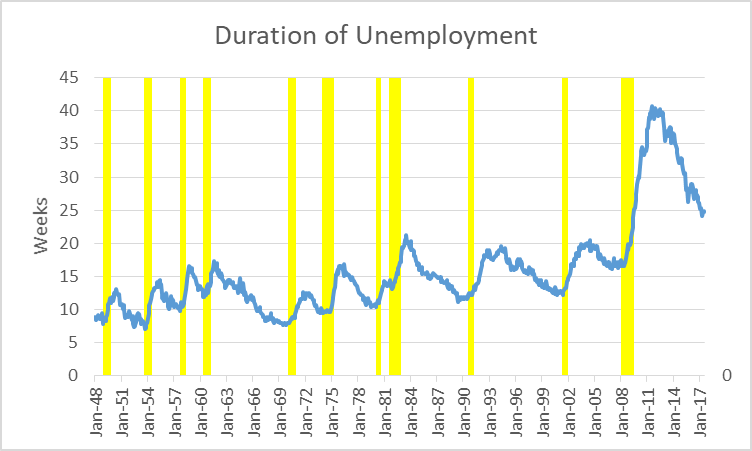
Duration of Unemployment
Nostalgia for an earlier era is understandable. The period of peak manufacturing employment was also a period when economic inequality hit its low. The next graph shows the Gini index over the post-war period. The index measures inequality: if the index were zero everyone would have the same income; a value of one indicates that all income goes to one person. The smaller the index the less inequality there is. The index bottomed out during the peak of manufacturing activity and has been rising ever since.

Gini Index 1947-2015
The growth in inequality has been accompanied by a gradual decline in the share of compensation that goes to labor as opposed to capital, as shown on the next chart. The labor share peaks in recessions because profits tank, but the overall trend is a steady decrease in the portion of compensation going to labor as opposed to capital.
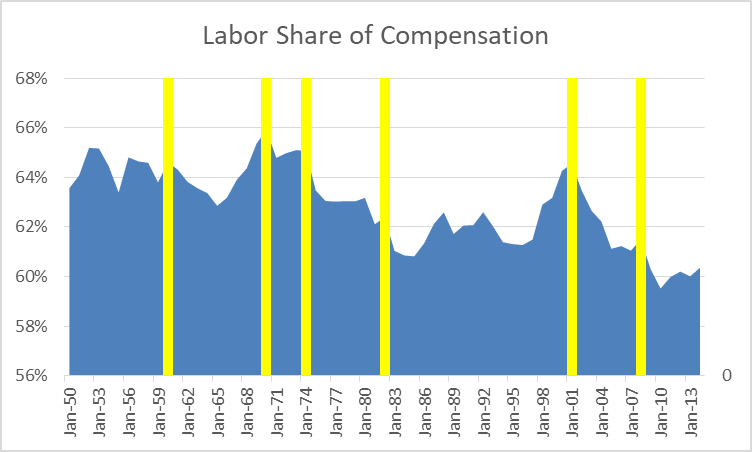
Labor Share of Compensation
Nostalgia for this era of peak manufacturing is understandable. But how much can state governments can do to slow or reverse the decline from this peak?
The national downward trend is reflected in numbers for Wisconsin and the other Great Lakes states, Illinois, Michigan, Ohio, and Indiana. The US Census Bureau groups these five states into the East North Central region. These states make up the core of the so-called “Rust Belt.” All five have historically emphasized manufacturing.
The US Bureau of Labor Statistics has published monthly estimates manufacturing employment by state since 1990. The totals for the Wisconsin and the other Great Lakes states are shown below. Manufacturing jobs in these states follow the same roller coaster pattern as does the nation. That said, each has its own distinct variation.

Manufacturing Jobs Since 1990
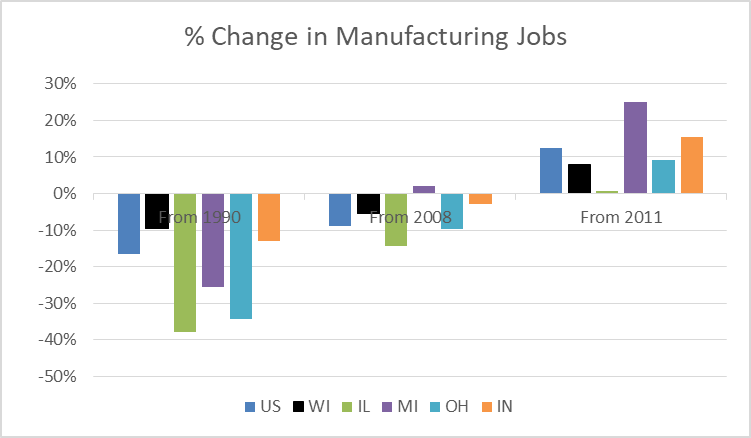
Although none of the states was able to escape the manufacturing decline associated with this century’s recessions, there are differences among their performances. All are down substantially compared to 20 years ago. In absolute numbers Wisconsin had—and still has—the smallest manufacturing sector.
The next chart shows the percentage change in manufacturing employment in the five states and the US as a whole ending in July 2017 for three different starting points:
- 1990, when the data series starts,
- January 2008, just before the Great Recession hit, and
- January 2011, as the recovery from the Great Recession entered its second year and when Scott Walker became governor.
Percent Change in Manufacturing Jobs
Reflecting its dependence on the auto industry, Michigan’s manufacturing employment was the most volatile during the period. Starting substantially larger than Wisconsin’s it shrank to a Wisconsin level during the Great Recession, only to see the strongest recovery as the auto industry sprung back.
There is a general consensus among those who have studied the issue that voters are too ready to blame or credit the governor and other officials for their state’s economy. Nevertheless, it seems likely that Illinois’ weak job performance–with almost no recovery from the Great Recession–can be attributed in large part to the inability of its governor and legislature to agree on how to pay for its unfunded pension obligations.
However, if one starts in 2011, the story is reversed. Wisconsin gained 8 percent more manufacturing jobs. Even with Illinois’ miserable performance, manufacturing jobs in the four other Great Lakes states grew 12 percent. Nationwide, they grew 13 percent.
This post-recession period is also when Wisconsin’s Manufacturing and Agriculture tax credit kicked in, virtually eliminating taxes on manufacturers. From the data, it is hard to argue that taxpayers benefitted from their investment.
It is important, at the same time, to recognize the continuing importance of manufacturing jobs in Wisconsin. As the next chart shows, since 1990 manufacturing jobs have dropped from 23 percent to 16 percent of all Wisconsin jobs. That is still a significant fraction. However, as the Foxconn proposal demonstrates, the price of buying new manufacturing has steadily risen.
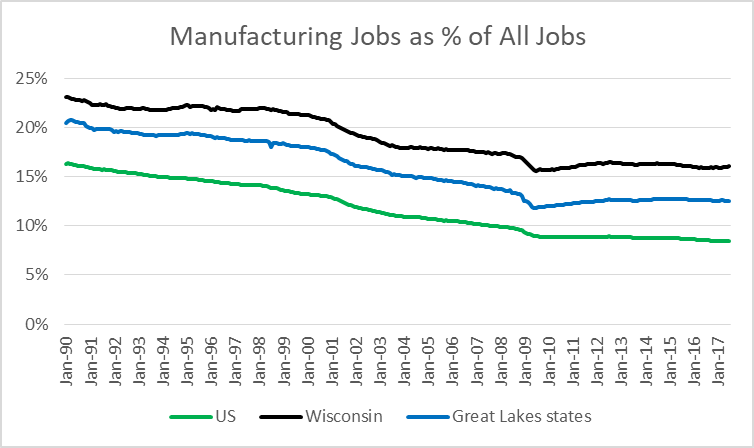
Manufacturing Jobs as a Percent of All Jobs
This lack of demonstrable success for the tax credit is one piece of evidence that would suggest caution about the standard model followed by Wisconsin and other states aimed at economic development. It puts particular faith in certain government actions, including tax reductions—especially ones targeted at particular business sectors, relief from environmental and other regulations, and a concentration on landing a big brand name firm by offering large public incentives). This approach does not enjoy a strong record.
The data suggests it is time to rethink this approach. An alternative approach might concentrate on the traditional roles of government, such as maintaining and modernizing infrastructure, upgrading the skills and education of its population, and enhancing an attractive environment.
Data Wonk
-
Why Absentee Ballot Drop Boxes Are Now Legal
 Jul 17th, 2024 by Bruce Thompson
-
The Imperial Legislature Is Shot Down
 Jul 10th, 2024 by Bruce Thompson
-
Counting the Lies By Trump
 Jul 3rd, 2024 by Bruce Thompson


Good job. Once again, Bruce, you look at an issue by starting with the data — the facts — and see what conclusions can be drawn from them. Conclusions, like yours here, reached on the basis of facts, ought to have greater weight and credence than conclusions drawn by others resting on nothing more than ideological beliefs.
This is good stuff but my thoughts continually come back to the antipathy which seems to ooze from our state leaders have for higher education and its role in economic development. There seems to be a real misunderstanding of that role and of how the knowledge and/or discoveries of the research facilities as well as cultural contributions of the university system might and does make. The continual (it seems to me) attacks on UW-Madison and/or other schools within the UW system are troubling and my suspicion is that it stems in part from a distrust of science, a misunderstanding of the role of the humanities, and a fear that these campuses are “liberal incubators” and not centers of entrepreneurial development. Maybe I’m just too ideological and willing to find conspiracies everywhere. Thanks for this.
Take a look at high tech and high productivity farming in the Netherlands!
http://www.nationalgeographic.com/magazine/2017/09/holland-agriculture-sustainable-farming/
Would Wisconsin step up to this?