How to Attract Jobs to Wisconsin
Walker’s policies haven’t worked. More urban-centered policies could improve things.
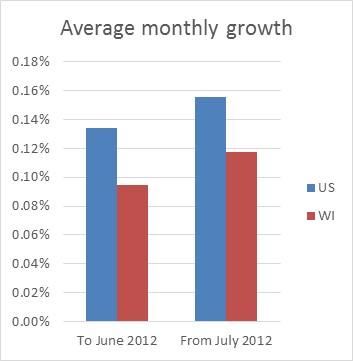
Average monthly growth
Could Wisconsin improve its policies when it comes to trying to grow businesses and jobs? Yes, and I’ll get to that in this column, but change is unlikely to come unless state leaders honestly face up to the failure of their current approach, which I detailed in a past column. Various responses to this failure have been offered.
One is that political uncertainty due to the recall elections early in Walker’s term held down growth. The chart to the right shows the average monthly job growth before and after the June 2012 recall election. There was indeed a slight increase in growth after the election. However, the nation as a whole also experienced a slight increase in the average growth rate.
Jobs generally act as a lagging economic indicator. Employers are often reluctant to lay off employees when business turns down, until it is absolutely necessary. This means they often have extra capacity when demand turns back up. As a result of this and the fear a recession creates, growth in demand may not create an immediate growth in jobs.
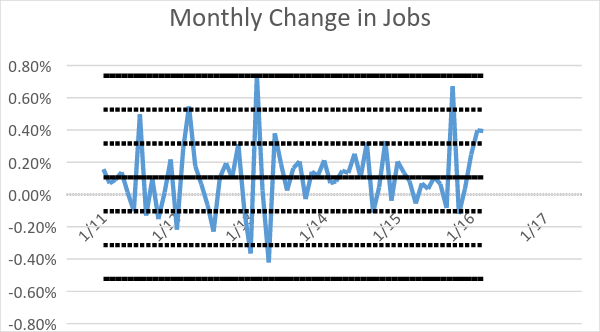
Monthly Change in Jobs
Many companies have used process control charts to separate random variation from a real change in the process. The next graph is a process control chart for Wisconsin jobs. The middle dotted line is the mean of the monthly changes between January 2011 when Walker took office until February of this year. The top and bottom dotted lines are three standard deviations (“three sigmas”) away from the mean. A six sigma range is commonly chosen because there is well under a one per cent chance that any value will fall outside due to random variation.
Reviewing this chart, most quality control managers would probably conclude that the underlying process had not fundamentally changed over the past five plus years.
One challenge in dealing with data, like those for jobs, with high monthly variability, is to separate the “signal”—the underlying trend—from the “noise”—the random variation caused both by error in data collection and large employer hiring decisions. When the March data were released the Journal Sentinel published an article pointing out that the year-to-year increase was the best in several years, which some readers referenced in response to my column on Walker’s failure to grow jobs.
As can be seen from the next chart there is considerable month-to month fluctuation in the jobs numbers. It is hard however to distinguish between these variations and the possible start of a new trend.
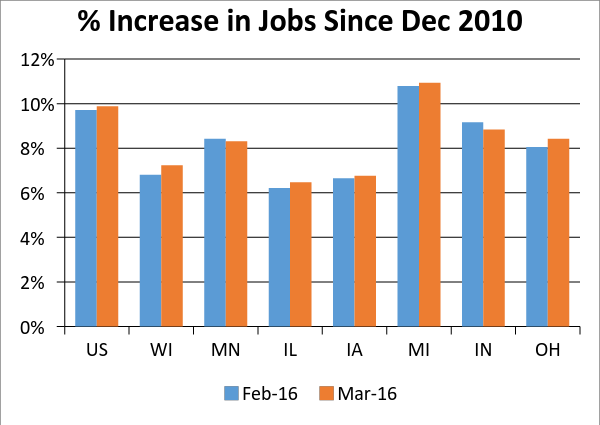
% Increase in Jobs Since Dec 2010
The critical problem in judging whether a state government’s policies have a positive, negative, or negligible effect on jobs is the difficulty in separating the effect of the policies from the many other factors affecting a state’s economic performance. For example, the March Bureau of Labor Statistics jobs report shows a decline in jobs over the past year in six states: North Dakota, Wyoming, Kansas, Oklahoma, Louisiana, and West Virginia. Noting that these states have been highly rated by two conservative organizations—ALEC and Cato—liberals might be tempted to treat these results as evidence of the folly of the conservative economic prescriptions. However, there is something besides Republican governors these states have in common: carbon-based energy sources—oil and coal–play a heavy role in their economies. As a result they are among the states suffering from the collapse in oil prices.
Perhaps some day researchers will figure out ways to separate the effects of state economic policies from the many other factors affecting state economies. That could stem from better economic models or additional data collection, for instance. Until then, it is wise to be careful in drawing conclusions based on state differences.
A place to start the search of effective long-run economic policies may be two fairly recent conclusions on where jobs come from. The first is that most jobs are created by recent startups. While some mature companies are adding jobs, these are offset by other mature firms that are shedding jobs. This implies that policies should aim at creating an environment conducive to startups.
This suggests a wholly different paradigm to job growth. The old paradigm was: how do we attract existing firms to relocate to our state or add a facility here? This often included a package of financial incentives. At best, this paradigm led to a zero-sum game in which one state’s gain was another state’s loss. It also led to a transfer of wealth from taxpayers to companies. Implicit in this paradigm was a trade-off on quality-of-life issues, ranging to poor funding of public services such as schools to the easing of environmental regulations to attract businesses.
The new paradigm suggests that rather than a trade-off between economic growth and quality of life, an attractive environment is a crucial tool in developing the economy. With the right policies, cities like Milwaukee can attract the people who will eventually start the companies that bring job growth.
This concept was developed in two articles by Paul Graham, a Silicon Valley entrepreneur who has developed a program to support other entrepreneurs. In the first, from 2016 and entitled How to be Silicon Valley, Graham writes, “Wherever the startup is when it gets funded, it will stay. … So if you want to reproduce Silicon Valley, what you need to reproduce is those two or three founders sitting around a kitchen table deciding to start a company.” He then goes on to speculate what makes a town attractive to potential entrepreneurs:
For example, they like well-preserved old neighborhoods instead of cookie-cutter suburbs, and locally-owned shops and restaurants instead of national chains. Like the rest of the creative class, they want to live somewhere with personality. … Most towns with personality are old, but they don’t have to be. Old towns have two advantages: they’re denser, because they were laid out before cars, and they’re more varied, because they were built one building at a time.
To attract the young, a town must have an intact center. In most American cities the center has been abandoned, and the growth, if any, is in the suburbs. Most American cities have been turned inside out. But none of the startup hubs has: not San Francisco, or Boston, or Seattle. … Silicon Valley proper is soul-crushing suburban sprawl.
Graham then goes on to extoll a tolerance for eccentricity:
But a place that tolerates oddness in the search for the new is exactly what you want in a startup hub, because economically that’s what startups are. Most good startup ideas seem a little crazy; if they were obviously good ideas, someone would have done them already. … “That’s the connection between technology and liberalism. Without exception the high-tech cities in the US are also the most liberal. But it’s not because liberals are smarter that this is so. It’s because liberal cities tolerate odd ideas, and smart people by definition have odd ideas.
In the 2006 article Graham argued that, despite having one of the foremost information technology departments at Carnegie Mellon, Pittsburgh, where he grew up, had failed to develop a technical startup hub. He attributed this to bad weather and “no interesting old city to make up for it.” This year he returned to Pittsburgh and discovered a new sense of excitement. If the city wanted to build on this excitement, he advised it to protect the old buildings and to “make Pittsburgh the most bicycle and pedestrian friendly city in the country.”
Interestingly, this message seems to have been incorporated in SEWRPC’s report on its Vision 2050 plan for transportation and land use in southeast Wisconsin. Among its proposals are eight rapid transit corridors, two commuter rail corridors (to Oconomowoc and Kenosha) and two rail lines (to the Twin Cities via Madison and to Green Bay), as well as a network of bicycle trails.
In recent years, there has been a remarkable resurgence in the popularity of city living. This has been most dramatic in cities on the west and east coasts, but we are seeing signs of this in Milwaukee. If the politicians and talk show hosts don’t succeed in sabotaging this effort, Milwaukee’s current revival can be just the start. And new policies by Gov. Scott Walker that support this transformation — devoting some state transportation money to bicycle and rail transit, for instance — could be very helpful.
Data Wonk
-
Why Absentee Ballot Drop Boxes Are Now Legal
 Jul 17th, 2024 by Bruce Thompson
-
The Imperial Legislature Is Shot Down
 Jul 10th, 2024 by Bruce Thompson
-
Counting the Lies By Trump
 Jul 3rd, 2024 by Bruce Thompson


The first graph (comparing growth before and after the June 2012 recall election) is flawed. The vertical axis is mis-labeled: the first three steps are each labeled 0.00%, the next 5 are each labeled 0.1% and the last 2 are both labeled 0.2%
There does seem to be a point on that Shewhart chart that violates the first WERR… Although it’s hard to tell if the point is above the UCL. I’d stop the machines, but this is a pretty small sample set with (as Mr Thompson pointed out) a lot of inputs.
Points for using statistical control, though. I’d imgine the author has an extensive stat background. Whaddya wanna bet some extremist talk-radio type comes along and accuses UM of using “tricky math” to obfuscate the numbers? That’s not to say that stats should be used to assume one conclusion or another. And that first graph… yikes.
Still, catering to the inventive types may not be a bad idea. It will just be a matter of cost vs payout.
Tom d,
Thanks for pointing that out. The scale should run from .00% to .18% in increments of .025. Somehow, they all rounded to the nearest .1%. I hope that can be corrected.
What is missing from the discussion is the backdrop that drastic measures have been taken in the discussed time period and dramatic results were promised in multiple campaigns. While the data may have low statistical significance, they definitely show NO noticeable (much less dramatic) trend upward. In research terms, the NULL Hypothesis (that political and administrative changes had no effect) is not even remotely threatened. That means no evidence for any kind of SUCCESS narrative.