Wisconsin Ranks Last In Welfare Reform
A conservative group’s ranking of results suggests the state ranks 50th in the results of its reforms.
The conservative and Libertarian Heartland Foundation recently issued to its Welfare Reform Report Card, updating its report card from 2008. It rates the states in two dimensions: policies and results.
For starters, the report rates states according to how well they have implemented five welfare policies:
- Service integration, organizing state social service systems to allow coordination of welfare and other services
- Work requirements, requiring aid recipients to engage in work or work-related activities
- Cash diversion, allowing caseworkers to give lump-sum payments to meet short-term needs
- Lifetime limits on eligibility for aid, typically five years or less
- Sanctions to require compliance with work and other requirements
Two other policies were included in the 2008 report but were dropped from the most recent one. The first, increased filing for the federal Earned Income Tax Credit was dropped because the authors were unable to obtain IRS data on the credits.
The second policy dropped was family caps, which try to discourage additional births among recipients by denying payments for children born while their mothers are receiving TANF (Temporary Assistance for Needy Families) payments. Wisconsin is a family cap state; its grants do not vary with family size. Family caps have been attacked from a number of directions—that they promote deep poverty, are ineffective in reducing pregnancy, and may lead to more abortions. The Heartland report’s comment is that “researchers have found those policies may have unintended consequences, and they are not believed to be as effective as once thought.”
When it comes to its policies, Wisconsin is ranked very high by Heartland: it’s tied for third place with two other states, up from 7th place in the 2008 report.
But Heartland also ranks states by their results, again using five measures:
- Change in the number of recipients on TANF between 1996 and 2014
- Change in poverty rate from 1996 to 2011
- Work participation by TANF recipients, 1997-2011
- Change in unemployment rate, 1997-November 2014
- Change in teen birth rate, 1996-2012
On these outcome measures, Wisconsin is rated 50th — dead last — among the states. The fact that Wisconsin rated near the top in policies and at the very bottom in performance suggests that the policies recommended by Heartland fall short in producing the desired results—more people working and fewer in need. At least in the case of Wisconsin, the apparent failure cannot be chalked up to policies given too short a time to show results. Wisconsin was rated 7th best for policies in 2009.
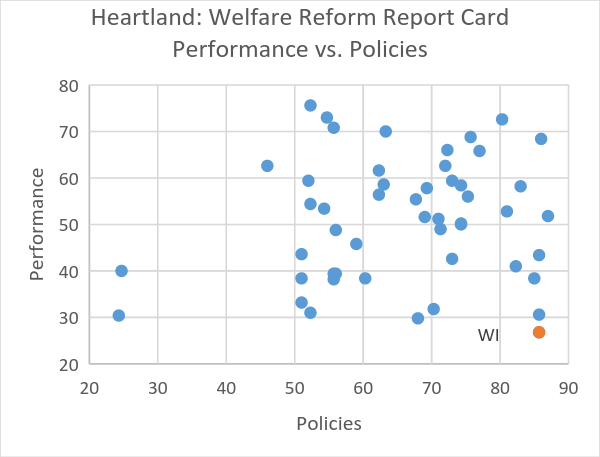
Heartland: Welfare Reform Report Card Performance vs. Policies
But as the plot to the right shows, there is little connection between the policy and performance ratings. Any correlation (slightly positive if all states are included, slightly negative if Massachusetts and Missouri, the two outliers on the left, are excluded) is not statistically significant.
The authors briefly refer to the “weak correlation between policies and outcomes.” However, this does not cause them to rethink the policies. Instead they ask the reader to take the effectiveness of the policies on faith: “The purpose of this survey is not to prove some policies work better than others – that research has been done well by others. Our goal, instead, was to bring together in one document data addressing widely agreed-upon measures of anti-poverty success and the most promising welfare policies. We are convinced states will see better results if they adopt the recommended policies.”
If reducing welfare requires both a carrot and stick, the policies advocated by Heartland are heavily skewed towards the stick side of the spectrum—work requirements, lifetime limits, and sanctions. But the policies heavily date from the 1990s, a period of abundant jobs. Jobs today are much harder to find, particularly in neighborhoods with high poverty. At best, Heartland is pushing a set of policies that are only a part of the solution—and probably a minor part as well. This is particularly true if one defines the goal of welfare reform as increasing both the number of people employed and their financial success, rather than just decreasing welfare rolls.
In an earlier column, I described a proposal from Milwaukee-based Community Advocates to address the carrot side of reducing the number of people on welfare. It included five elements, the first four of which either would make more jobs available or make them more attractive:
- Transitional jobs
- Increase in minimum wage
- Expand Earned Income Tax Credit
- Child care subsidies
- Tax credit for Social Security and disability
This proposal was estimated by the Urban Institute to reduce the rate of poverty by half or more. Perhaps the lack of correlation between the policies advocated by Heartland and the results reflects their one-sided bias towards punitive policies.
In the same column, I discussed Part I of an article by Christopher Jencks assessing the results of the War on Poverty, entitled “Did we lose the War on Poverty?” In Part I, he estimates that poverty, as understood in the 1960s, has been reduced by about three quarters.
In Part II (which charges readers to download), he tackles the question of which parts of the War on Poverty were most effective, concentrating on five programs:
- Head start. Early research found that children in Head Start Initially make more academic progress than similar children not in the program, but that the academic advantage wore off over time. This led to the discouraging conclusion that Head Start had little or no long-term effect. However, more recent research has found other differences as the children grew into adulthood. For instance, they were more likely to finish high school and enter college and less likely to be arrested. Other studies comparing children matched except for whether or not they attended Head Start, found that the Head Start alumni had higher incomes and were less likely to smoke, to have been put in special education, or to use drugs.
- Title 1. In this program the federal government sent millions of dollars to schools serving low-income students. Jencks concludes there is little solid evidence that Title 1 reduced differences between rich and poor districts on math and reading scores. In his words, Title 1 “still pushes money into the hands of educators who do not raise poor children’s test scores.” Earlier the threat to withhold Title I money gave the federal government more leverage to force southern schools to integrate. More recently it has been used to encourage states to upgrade their learning goals and to push districts to do something about low-performing schools.
- Financial aid for college students. Jencks concludes that expanded loans and grants did not reduce the disparities. Graduation rates increased more for upper income students than for those whose families were at the bottom. He concludes that rising college costs and the use of student loans worked against the goals, because low-income students especially were discouraged from attending college by the prospect of incurring crushing student debt.
- Social Security. He concludes that “raising Social Security benefits was, in short, the simplest, least controversial, and most effective antipoverty program of the past half-century.”
- Food stamps. Jencks concludes the research shows that increasing availability of food stamps had a significant effect on the health of poor people.
Poverty has been among the most frustrating issues faced by the U.S. and Wisconsin. If progress is to be made, it is important not to fall in love with any particular set of solutions. Instead, ways should be found to measure the effectiveness of the solutions and modify or drop those that do not work. Doing so becomes particularly difficult for those, like the Heartland Institute, who have an ideological commitment to a certain set of solutions.
Data Wonk
-
Scott Walker’s Misleading Use of Job Data
 Apr 3rd, 2024 by Bruce Thompson
-
How Partisan Divide on Education Hurts State
 Mar 27th, 2024 by Bruce Thompson
-
Will Wisconsin Supreme Court Legalize Absentee Ballot Boxes?
 Mar 20th, 2024 by Bruce Thompson


Not sure I understand what we are supposed to take from this.
Can we say, based on this, that “welfare policies” have very little if anything to do with the overall well-being of the actual and potential beneficiaries of said policies? If so, then should society focus less on the nature and extent of the welfare policies and more on OTHER factors that DO have beneficial consequences? For example: a thriving economy, greater accountability for the delivery of quality education, more effective public/private collaboration regarding job skills development, etc.?