What the 2025 Elections Data Tells Us
Does stunning change in voters' preferences foretell fall election results?

Voters at the Humboldt Park Pavilion. Photo by Jeramey Jannene.
Special elections since the 2024 presidential election suggest that things are looking up for Democrats. Since the most recent Wisconsin election, for the Wisconsin Supreme Court, took place last spring, one must look at elections in other states for data on more recent developments.
In November 2025, seven states voted for candidates or issues. The chart below shows the outcomes, with the Democratic margin or deficit in the seven states.
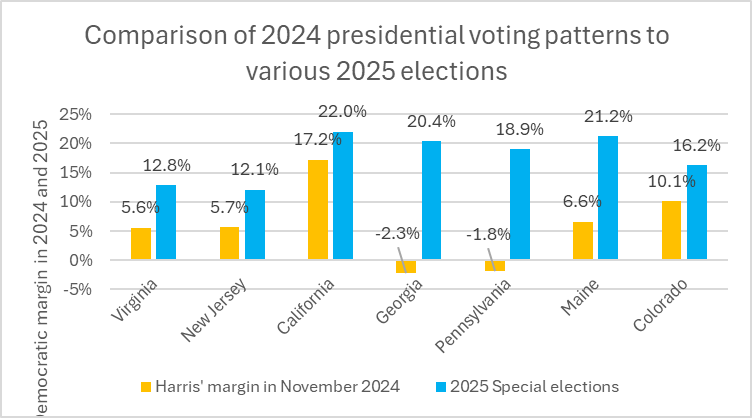
Comparison of 2024 presidential voting patterns to various 2025 elections
The yellow columns in the chart compare Kamala Harris’ margin over Donald Trump’s in the 2024 presidential election. For example, in Virginia, Harris won 5.6 more percentage points than Trump, while she narrowly lost Georgia and Pennsylvania by 2.3 and 1.8 percentage points, respectively. The blue columns show how the result for Democrats changed:
- Virginia and New Jersey elected new Democratic governors. New Jersey had been predicted to be particularly close. Yet in both states, the Democrat won by more than 12 percentage points.
- In California, Proposition 50 was passed with a margin of 22 percentage points. It would redistrict the state to increase the number of Democratic congressional seats in response to moves by Texas and other Republican states to gerrymander their districts to create more Republican districts.
- In Georgia, two Democrats defeated two incumbent Republicans for seats on the state utility board. The chart shows the average of the two.
- In Pennsylvania, two Democratic Supreme Court justices were reelected with comfortable margins (again showing the average of the two).
- Voters in Maine voted on two ballot measures. The first would have increased restrictions on voting. The second proposed a “red flag law” allowing courts to order individuals not to carry guns. For this analysis, a “no” vote on the first and a “yes” on the second were counted as the Democratic vote.
- Colorado voters supported a proposal to increase taxes on wealthy households to fully fund free breakfast and lunch for all public school kids and to bolster the federal Supplemental Nutrition Assistance Program. For this analysis, a “yes” vote was treated as a Democratic vote.
During 2025, five special elections were held in U.S. House districts to replace incumbents who had resigned or died. The yellow column shows the difference in percentage points by which the Democratic candidate lost or won in 2024, compared to the blue column showing the percentage points by which the Democrat lost or won in the 2025 special election. For example, in the 1st Florida district, the Democratic candidate lost by 32 percentage points in 2024 and by just 14.6 percentage points in 2025. As the graph shows, Democrats won two of these districts and Republicans three. None of those districts flipped from one party to the other, but in all five, the Democratic percentage of the vote rose by at least 12 percentage points.
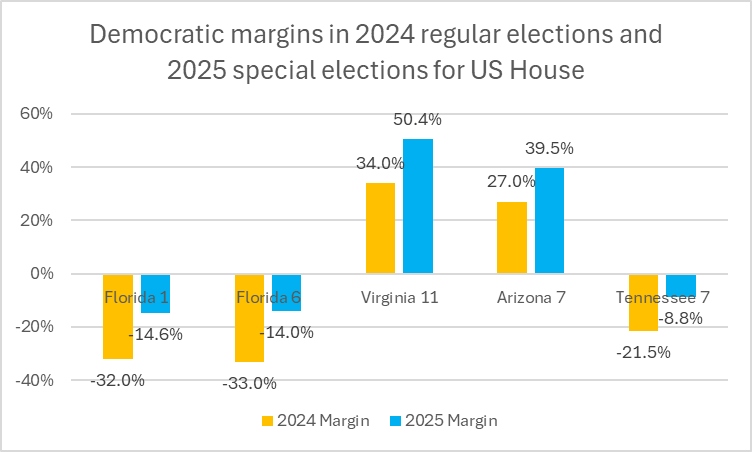
Democratic margins in 2024 regular elections and 2025 special elections for US House
More evidence that something was amiss for Republicans came early this year in a special election in the suburbs of Fort Worth, Texas. An article in The New York Times published shortly before the vote described this race as “a long shot for Democrats.” After all, in 2024, Trump won the 9th Texas state Senate district by 17 points. In January, the Democratic candidate carried that district by 14 points. The result was a 31-point flip from Republican to Democrat. This result came despite Trump’s public endorsement of the Republican candidate.
Susan Crawford’s 10-point victory over Brad Schimel for the Wisconsin Supreme Court is widely attributed to a difference in the voters who turn out for Supreme Court elections from those voting in presidential elections. It is notable, however, that it came at a time when, according to The New York Times, Trump’s favorability was shifting from positive to negative. Also, Schimel was making his appeal largely on his alliance with Trump.The next graph suggests that the decline in support for Republican candidates is not limited to the relatively small number of places that held elections since the 2024 presidential election took place.
The graph below summarizes Trump’s approval rating since his inauguration last January. The solid green line shows his approval based on the Times’ daily average of polls conducted by many different organizations. The solid red line tracks the daily average of respondents saying they disapprove of Trump.
The dashed red and green lines plot approval based on Marquette Law School’s poll of Wisconsin voters, showing the same tale of growing disapprovals and shrinking approvals over time.
The three red and green dots (with no line) show the results of Marquette Law School’s three polls of Wisconsin voters since Trump’s inauguration.
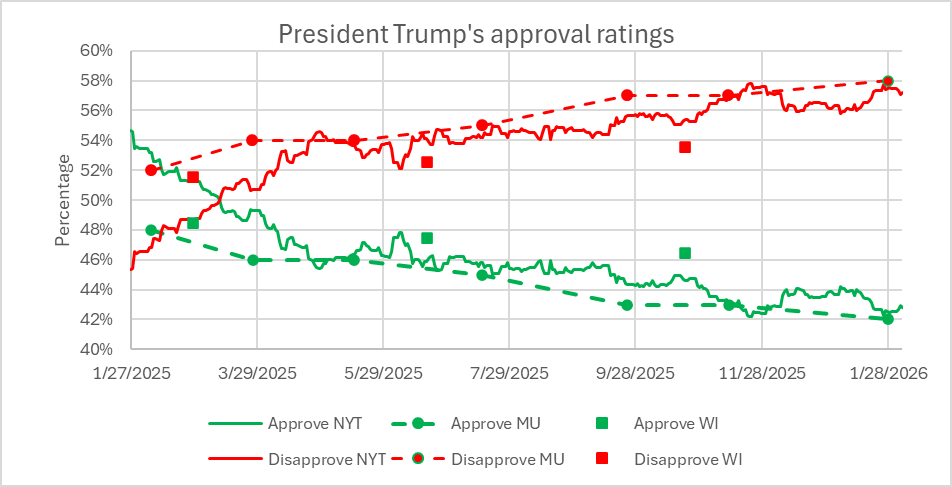
President Trump’s approval ratings
Several actions by Wisconsin Republicans may partly reflect the story told by special election results. These include:
- The lack of interest among Republicans in running for governor. This contrasts with overwhelming interest among Democrats.
- The announcement by Republican state Sen. Rob Hutton that he decided not to run for reelection. He was already considered one of the most vulnerable legislators.
- The decision by Justice Rebecca Bradley not to run for reelection, combined with the apparent difficulty in fundraising by Judge Lazar, who is running to replace her.
While these are hopeful signs for Democrats, it should be stressed that there are no guarantees in elections. One danger is overconfidence among Democrats. Another is that Trump has a history of outperforming the polls. Finally, it appears that Republicans will have a huge financial advantage in this fall’s election.
If you think stories like this are important, become a member of Urban Milwaukee and help support real, independent journalism. Plus you get some cool added benefits.
Data Wonk
-
Who Do You Trust to Conduct Elections Fairly?
 Apr 6th, 2026 by Bruce Thompson
-
Is Non-Citizen Voting a Real Threat to Elections in Wisconsin?
Mar 18th, 2026 by Bruce Thompson
-
How Global Climate Change Affects Milwaukee
 Mar 11th, 2026 by Bruce Thompson