
How The Minimum Wage Declined
40 years ago it was worth three times more. What happened?
McDonald’s – Bay View, 830 E. Potter Ave. Photo by Dave Reid.
In real terms, both the federal and Wisconsin minimum wage have been shrinking for 40 years. Should Wisconsin break away from the federal model and adopt a higher minimum wage?
For more than a decade Wisconsin’s minimum wage has been set equal to the US minimum wage. The last time the federal wage increased was in 2010, to $7.25 per hour. Since then, the nominal wage has lost about 34% of its value.The blue line in the next graph shows the nominal value—the value in then-current dollars—of Wisconsin’s minimum wage since 1968. Although the nominal value steadily increased, it did not keep up with inflation.
The orange line shows the value of the minimum wage in real 2025 dollars. The real value of Wisconsin’s minimum wage peaked in the early 1980s. In terms of purchasing power it was then worth $20.75 per hour in today’s dollars, almost triple today’s minimum wage.
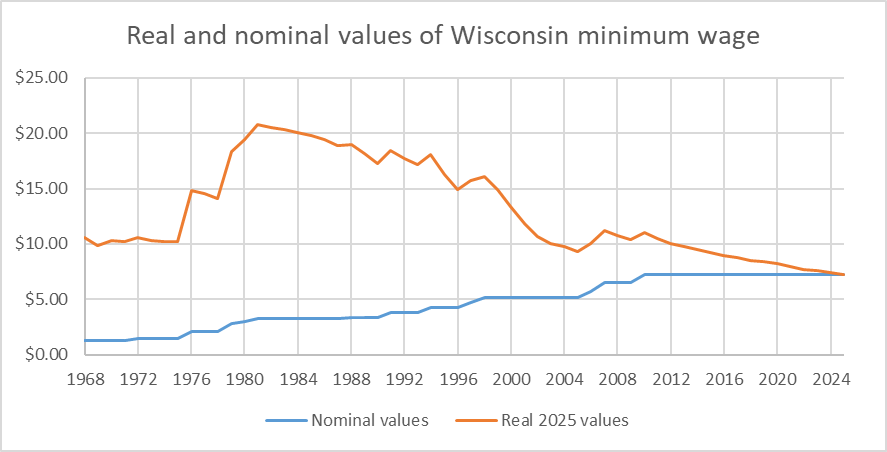
Real and nominal values of Wisconsin minimum wage
In recent years an increasing number of states have adopted their minimum wage to be well above the federal minimum. Whether or not to increase the wage has become tied to partisan considerations, as shown in the next graph. The graph’s horizontal axis shows the percentage of the 2024 presidential election two party vote won by Kamala Harris. States on the left of the dashed line were won by Donald Trump; those to the right were won by Harris and tend to have a much higher minimum wage. In fact, only one of the states won by Harris (New Hampshire) has stuck with the $7.25 federal minimum. The large green dot at the bottom of the graph represents Wisconsin, which chose Trump by the slimmest of margins yet it is stuck at the lowest tier of state minimum wages.
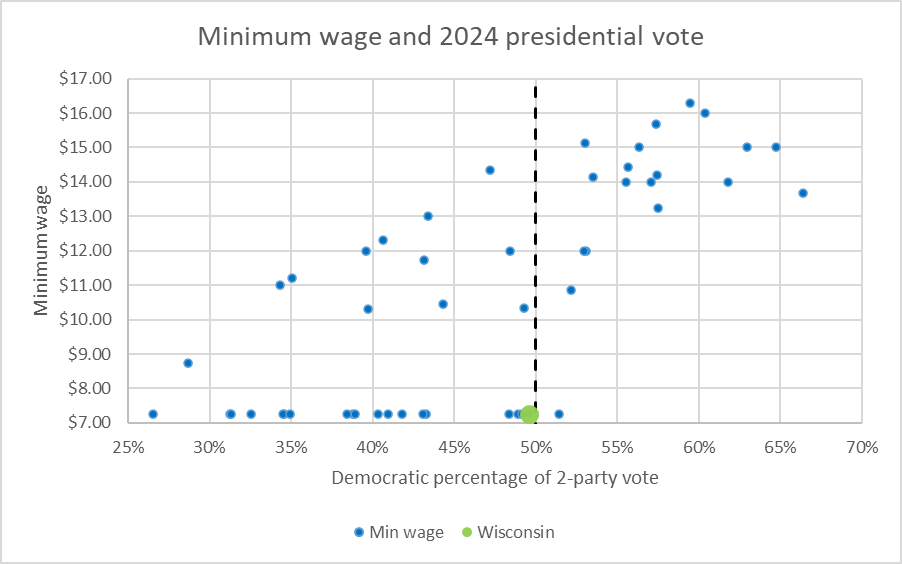
Minimum wage and 2024 presidential vote
The next graph shows in orange the states that automatically adjust their minimum wages to inflation, something that Wisconsin also doesn’t do.
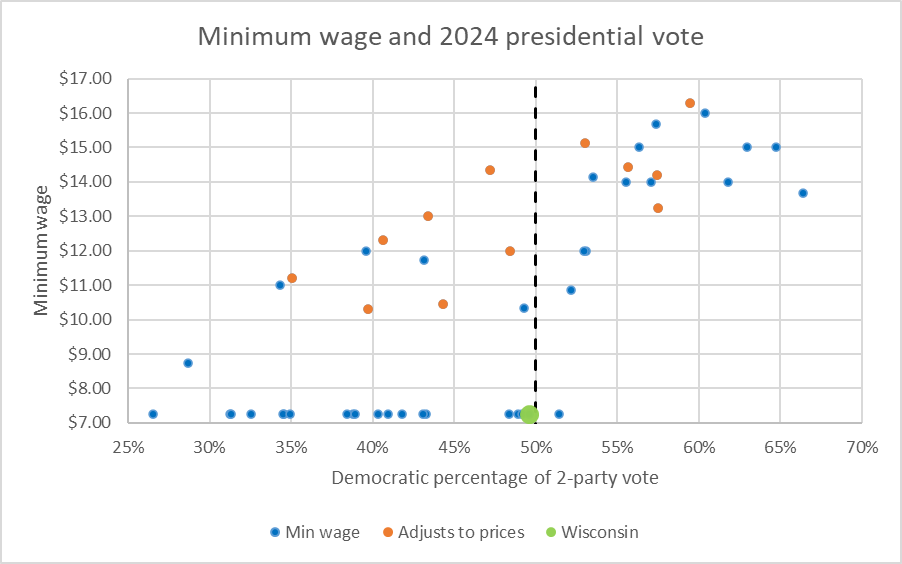
Minimum wage and 2024 presidential vote
Supporters of raising the minimum wage took advantage of provisions in their state constitutions allowing a referendum on issues to raise the wage. On the next chart, these states are marked with a circle. Four of these six states were solidly Republican.
Of the four states bordering Wisconsin, only Iowa has joined Wisconsin in refusing to raise the minimum wage. Michigan’s is set at $10.33 per hour, Minnesota’s at $10.85, and Illinois’ at $14.
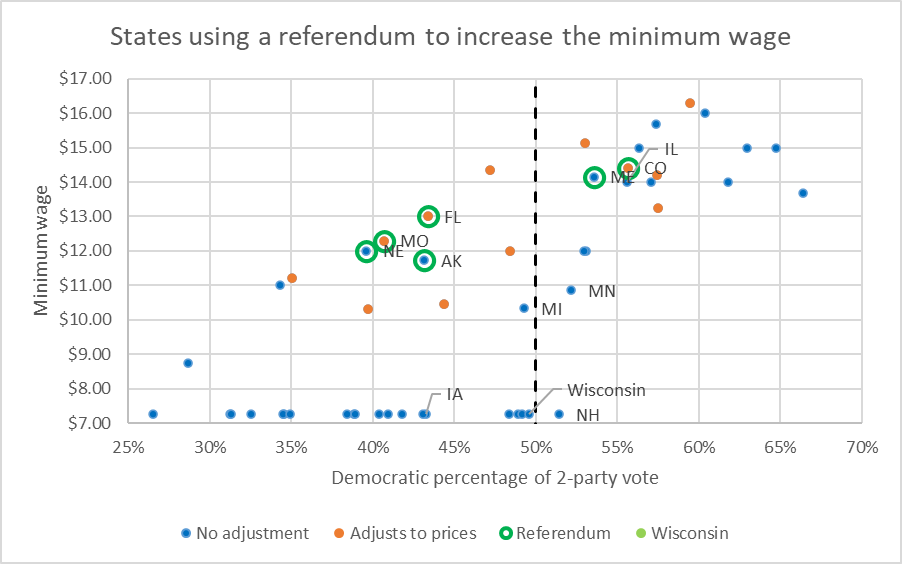
States using a referendum to increase the minimum wage
Over the years, the Marquette poll has asked a sample of Wisconsin voters whether they supported or opposed raising the minimum wage. The graph below summarizes the partisan skew from the August 2020 poll, the most recent time the question was asked. Democrats were overwhelming supportive. Republicans were opposed but less overwhelmingly than Democrats were supportive. A strong majority of Independents—and of the entire sample—supported raising the Wisconsin’s minimum wage.
These results are notably consistent with the earlier graphs showing states voting Democratic much more likely to support raising the minimum wage than states voting Republican.
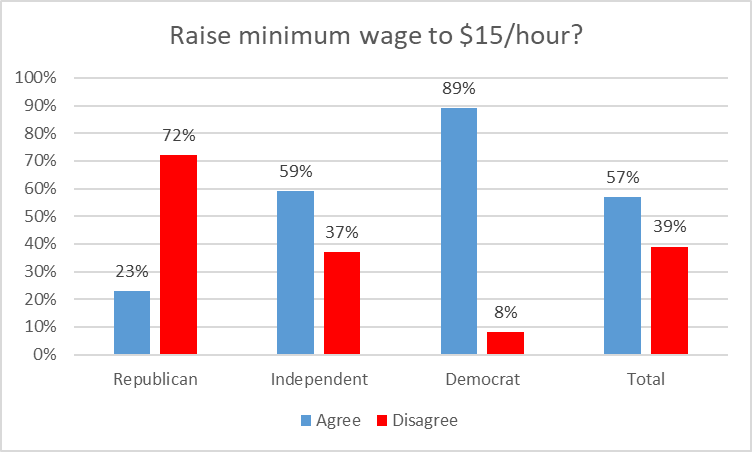
Raise minimum wage to $15/hour?
It seems clear that if Wisconsin voters were offered a referendum on raising the minimum wage, it would pass comfortably. In the previous legislative session, a group of Democratic state senators and representatives introduced 2023 Assembly Bill 1146 which would have raised the Wisconsin minimum wage in two steps. In the first year following its passage, the state’s minimum wage would have increased from the current $7.25 per hour to $10.85 per hour and to $15 per hour one year after the effective date of the bill. The bill was referred to the Committee on Labor and Integrated Employment, which took no action, and died with the adjournment of the Legislature.
The argument against increasing the minimum wage largely centers around the claim that doing so would result in job loss. The next chart shows the classic supply-versus-demand model. The vertical axis is the independent variable, in this case the dollars per hour paid to employees. The horizontal axis is the dependent variable, the quantity of labor hired.The blue line shows the relationship between the price of labor and its supply. It slopes upward: as pay goes up, the job becomes more desirable, and more people will want it. The red line shows demand for labor: As price of labor goes up, businesses hire fewer workers.
In the classic market model, equilibrium comes at the intersection of the two lines. In this example, 60 workers are hired, at a pay rate of $10 per hour. At this price point the demand for workers exactly equals the number of people wishing to do a particular job.
Now consider what the classic economic model predicts if the minimum wage is set to $12 per hour. At this wage, demand for workers drops from 60 to 40 while the supply of workers increases to 80. This difference between supply and demand is shown by the green line. The result is a gap of 40 workers who would like the job but could not get it.
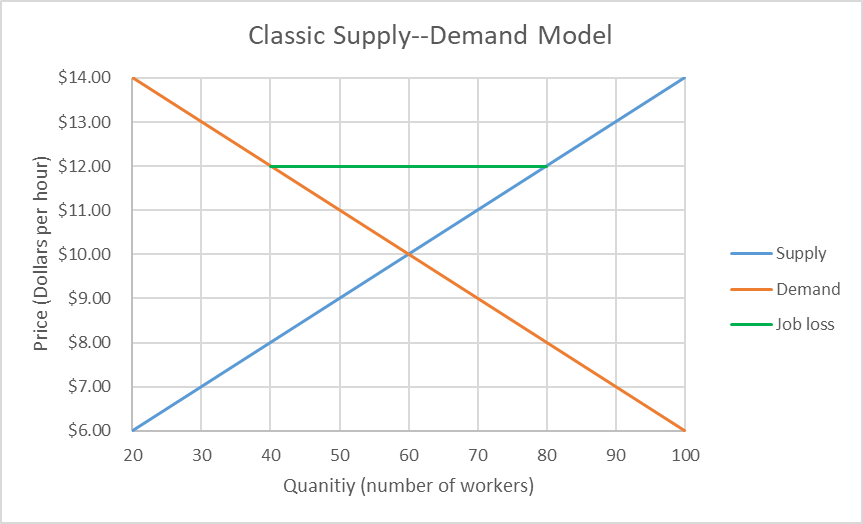
Classic Supply–Demand Model
For years this model was widely accepted as accurately predicting the result of increasing the minimum wage. The first major challenge came from an analysis by economists David Card and Alan Krueger in 1994. Their paper looked at the effect on employment in the fast food industry along the border between New Jersey and Pennsylvania, when New Jersey increased its minimum wage from $4.25 to $5.05. They found that there was no evidence that the minimum-wage increase in New Jersey reduced employment in that state relative to the comparison group of Pennsylvania restaurants.
The Card-Krueger study has led to something of an explosion of studies among economists who study the labor market. One issue is study design. This paper makes a compelling arguement for comparison studies, in which one state, county, or city raises its minimum wage, while a neighboring entity does not.Another issue is how big the minimum should be. According to surveys by the U.S. Bureau of Labor Statistics the average hourly earnings of all private sector employees in Wisconsin is currently about $34 per hour. Using the rule-of-thumb that the minimum wage is set at half the average wage gives $17.
Finally, the recent complaints from people saying they are working two jobs and still have trouble making ends meet is evidence that an increase in the minimum wage is sorely needed. Back in the early 1980s, when the minimum wage was worth triple the real dollar value of today, that second job might not have been needed.
If you think stories like this are important, become a member of Urban Milwaukee and help support real, independent journalism. Plus you get some cool added benefits.
Data Wonk
-
Who Do You Trust to Conduct Elections Fairly?
 Apr 6th, 2026 by Bruce Thompson
-
Is Non-Citizen Voting a Real Threat to Elections in Wisconsin?
Mar 18th, 2026 by Bruce Thompson
-
How Global Climate Change Affects Milwaukee
 Mar 11th, 2026 by Bruce Thompson


Many thanks to Bruce Thompson for his research. Shame on Wisconsin Manufacturing & Commerce Lobbyists, former Gov Walker and our Republican dominated Legislature (rigged disricts) have obsructed raising the Minimum Wage.
2025 Living Wage in Milwaukee, Wisconsin for one person is $20.09 hour according to
MIT’S Living Wage Calculator: https://livingwage.mit.edu/states/55/locations
VOTE in Mid-Term Elections November 3 2026.