How Did Politics Affect Covid Deaths?
Data by state shows interesting trend for Wisconsin, the U.S.

COVID-19. Credit: U.S. Army.
It’s been four years since the COVID-19 pandemic erupted, long enough to measure its variable impact. The graph below compares its the impact on residents of Wisconsin to that of the nation as a whole. To a large extent, Wisconsin reflected the peaks and valleys of the nation, with a couple of exceptions.
In the graph below the number of deaths nationally per month is shown by the left-hand axis and blue line. The deaths in Wisconsin are shown using the right-hand axis and yellow line.
One difference between the state and national deaths is that Wisconsin had a comparatively low initial peak in spring of 2020. As we shall see, this initial peak was largely driven by the arrival of Covid through the New York/New Jersey area.
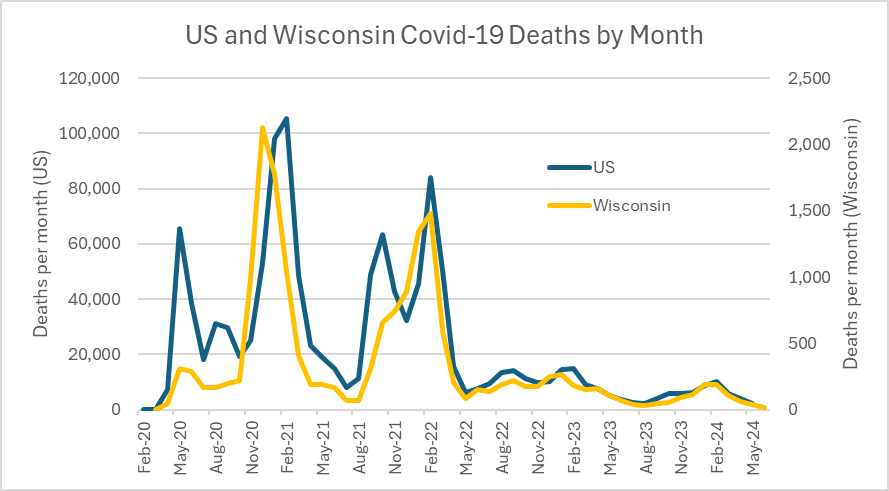
US and Wisconsin Covid-19 Deaths by Month
The next graph shows the number of Covid deaths in Wisconsin by year. In total, almost 18,000 Wisconsinites lost their lives as the result of COVID-19. And of course the number is still growing. Thus the total of 410 for this year is sure to grow by year’s end.
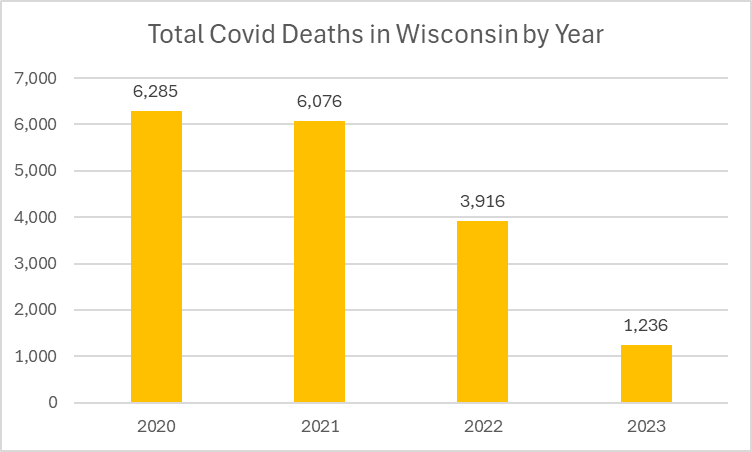
Total Covid Deaths in Wisconsin by Year
The next graph shows annual Covid deaths for the nation as a whole. A total of almost 1.2 million American residents died from Covid since 2020. As with data for Wisconsin, the number of deaths in 2024 will grow as the year progresses.
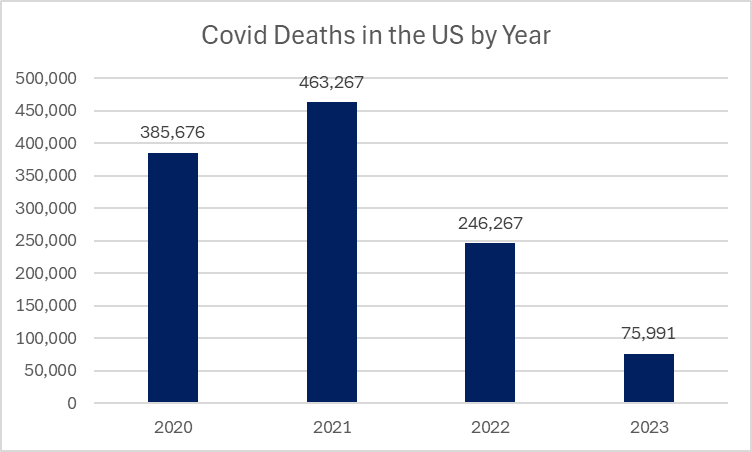
Covid Deaths in the US by Year
The next three graphs show the number of Covid deaths for each of the states for the years 2020, 2021, and 2022. The first shows the numbers for 2020.
It should be recalled that the response to Covid was chaotic. There was a shortage of masks and other protective gear, including for health workers.
It took a while to conclude that the main mechanism for spreading the virus was through the air. Meanwhile, there was great emphasis on “deep cleaning” of surfaces.Then-president Donald Trump played a major role in promoting unproven therapies, especially touting hydroxychloroquine and chloroquine. One analysis of Trump’s activities concluded that in the two months from March 1 to April 30, 2020, he made 11 tweets about unproven therapies and mentioned these therapies 65 times in White House briefings,
A surprising exception to this tale of incompetence in Trump’s reaction to Covid, was the process, called Operation Warp Speed, that came up with effective vaccines in the unheard of time of less than a year. This stands in sharp contrast to most other promises of the Trump administration, such as its promised updating of the nation’s infrastructure and promises to replace Obamacare with health insurance that is “better and cheaper.”
The next graph compares the number of Covid deaths per 100,000 people (on the vertical axis) to the results of the 2020 presidential election (on the horizontal axis). In this and the following two graphs Wisconsin is shown as a yellow dot. True to its typical role in the middle, Wisconsin has neither the best results nor the worst.
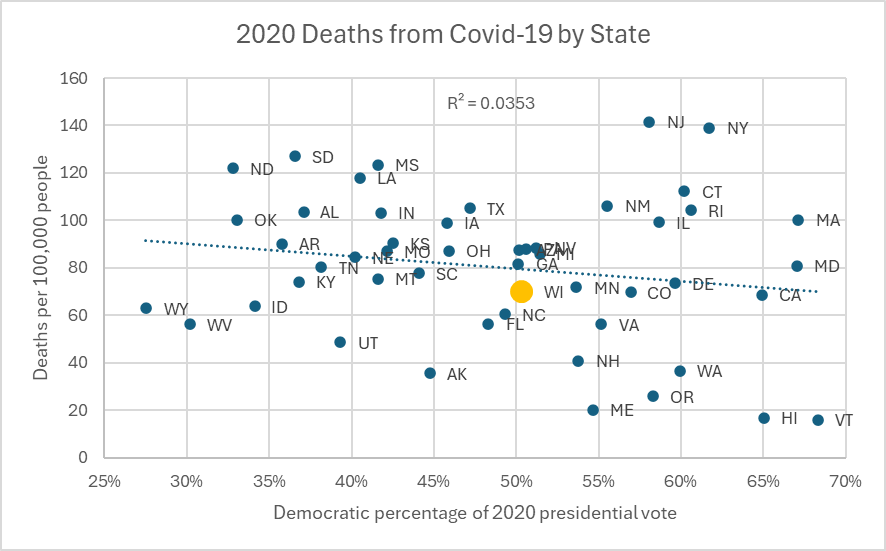
2020 Deaths from Covid-19 by State
In the response to the virus, did states voting for Democrats enjoy an advantage over Republican states in health results, or did Republican states have better results? The answer, from the above graph, is that in 2020 there was little or no relationship between partisan preference and Covid results. This is reflected in both the nearly flat trend line and in the very low value of R2, the coefficient of determination. R2 can be interpreted as saying that only 3.5% of the variation in per capita deaths reflects variation in the partisan orientation of the states.
A number of Democratic states, including Vermont, Hawaii, Oregon, and Maine, had per capita deaths substantially lower than the typical state. However, these states’ results were offset by substantially higher rates in New York and New Jersey, as well as middling results in states like Massachusetts and Maryland.
A look at the next graph, however, shows this changed in 2021. Comparing the 2020 results, shown above, to the 2021 results, in the graph below, shows that, as a group, Democratic states now had substantially lower per capita deaths. R2 increased from 3.5% to 39%.Two developments help explain the change from an environment in which vulnerability to Covid is essentially independent of states’ partisan choices to one in which Democratic states, on average, had fewer Covid deaths than Republican states.
One of these was the developing consensus among researchers that the main mode of transmission was through the air, pointing to the value of masks in preventing the spread of the disease. The second was development of highly effective vaccines by the end of 2020 and which were widely available by late spring of 2021.
These developments were combined with a growing, and surprising, hostility among Republican voters to masking and vaccination. The politicalization of masks and vaccinations was particularly strong in states that had favored Donald Trump.
This hostility to masks and vaccinations extended to conservative members of the Wisconsin Supreme Court. A dissent authored by Justice Rebecca Bradley described the Madison health officer as a “dictator,” an “autocrat” and “an unaccountable overlord.”
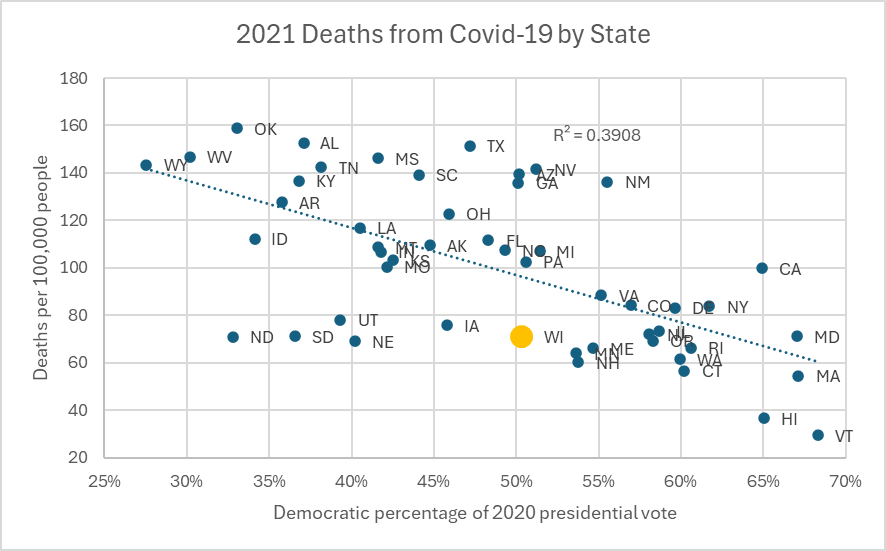
2021 Deaths from Covid-19 by State
The next graph shows the results for 2022, the pandemic’s third year. Democratic favoring states still show an advantage over Republican states, reflecting a greater vaccination rate. But the Democratic advantage is smaller, with an R2 of .24 compared to .39 in 2021.
One possible explanation for the decline in the Democratic advantage is that over time many of the unvaccinated people in Republican states caught Covid. Assuming they survived the encounter, they were likely to enjoy at least partial immunity to future infections.
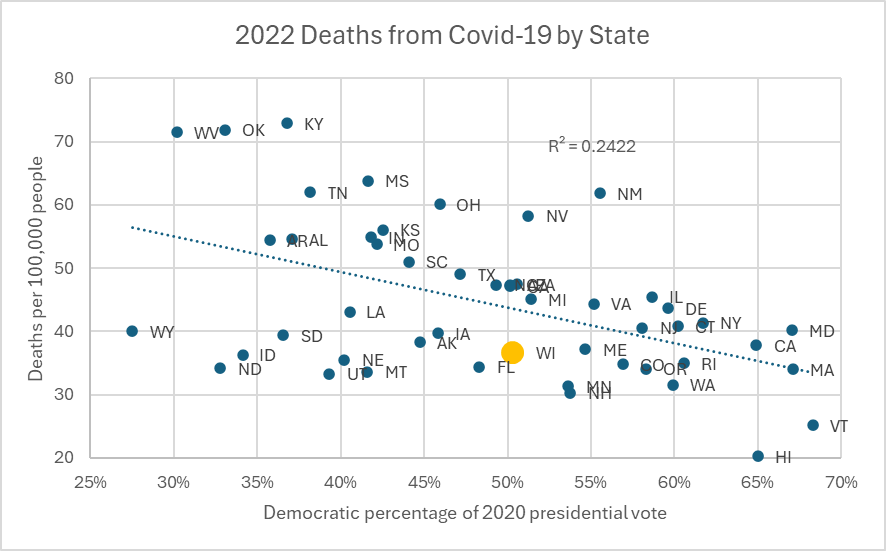
2022 Deaths from Covid-19 by State
What does the future hold for Covid? It appears, that absent some dramatic change in the virus, Covid will become a chronic, if low level, threat.
But there is reason to be concerned that the attacks on health workers by Trump and the MAGA crowd, including by members of the Wisconsin Supreme Court, will make health departments more reluctant to act when the next crisis hits.
If you think stories like this are important, become a member of Urban Milwaukee and help support real, independent journalism. Plus you get some cool added benefits.
Data Wonk
-
How Global Climate Change Affects Milwaukee
 Mar 11th, 2026 by Bruce Thompson
-
Will Lawsuits Demanding New Congressional Maps Succeed?
 Mar 4th, 2026 by Bruce Thompson
-
What the 2025 Elections Data Tells Us
 Feb 11th, 2026 by Bruce Thompson