
Crunching the Data on Spring Election
Which Milwaukee voters supported Biden, Trump, MPS referendum and City Attorney Tearman Spencer?
Vote here sign outside a Milwaukee polling place. Photo by Jeramey Jannene.
Only a few of the major races on Milwaukee’s spring ballot were competitive. Most notably, the latest Milwaukee Public Schools funding referendum passed by fewer than 2,000 votes. Both Joe Biden and Donald Trump put up relatively weak showings in their respective pro forma presidential preference votes. Evan Goyke won a landslide victory against the incumbent Milwaukee City Attorney. But the results were very different depending on where in Milwaukee the ballots were cast, our analysis shows.
Our findings are based on complete, but unofficial, election night vote totals. All demographic data is from the 2020 census. Registered voter statistics are based on the number of registrants entering election day; they do not include same-day registrants.
MPS Referendum
MPS Referendum
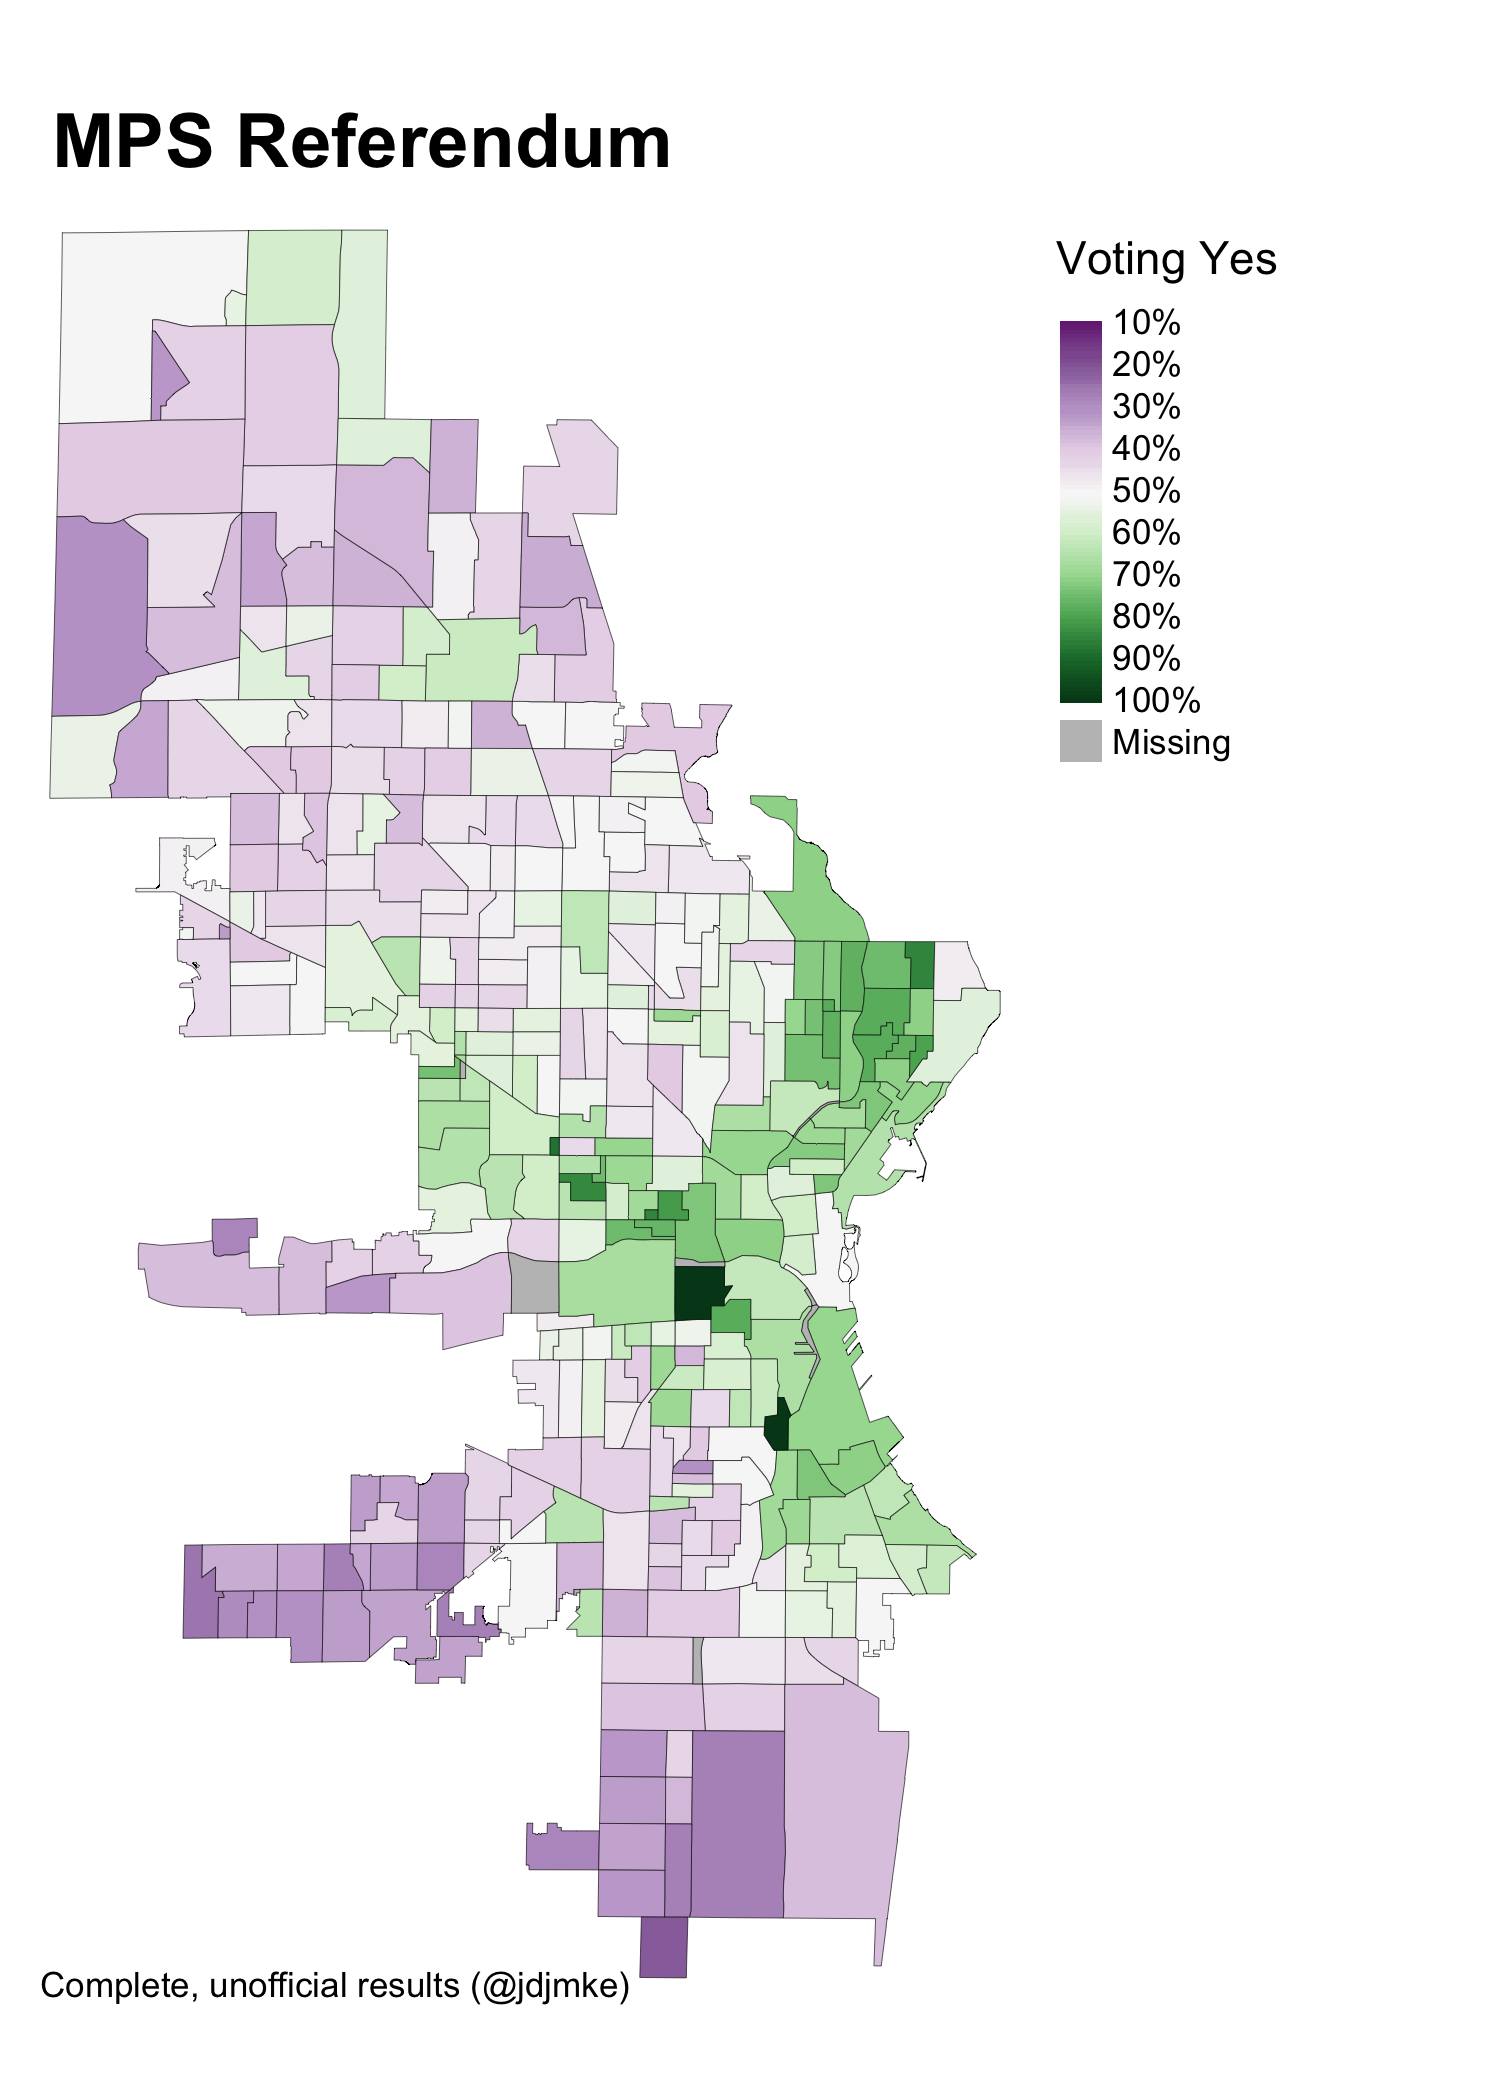
The referendum received about 41,600 “yes” votes to 39,900 “no” votes. The no’s actually won more wards—172 to 164.
As the map below shows, support for the referendum was strongest in neighborhoods along the lake and on the near west side. Opposition was strongest on the far south and southwest sides. Most north and northwest side wards also voted against the referendum.
These patterns do somewhat follow Milwaukee’s racial divisions. The “yes” vote won majority non-Hispanic white wards (53.2% for “yes”) while narrowly losing both majority Black wards (48.4% “yes”) and majority Latino wards (49.4% “yes”).
But these differences are small. The presence of children in a ward correlates much more strongly with the referendum vote.
In wards where fewer than 20% of households include a child under 18, the “yes” vote won by nearly two-thirds of the vote, 65.8%. But in places where more households have kids, it lost. In wards where 20% to 40% of households have a kid, 45.9% of voters supported the referendum. Where 40% to 60% of households have a kid, the “yes” vote took 46.9%.
These are just correlations. We don’t have data on how parents themselves voted. But we can say that the MPS referendum was most popular in the parts of the city with the fewest children.
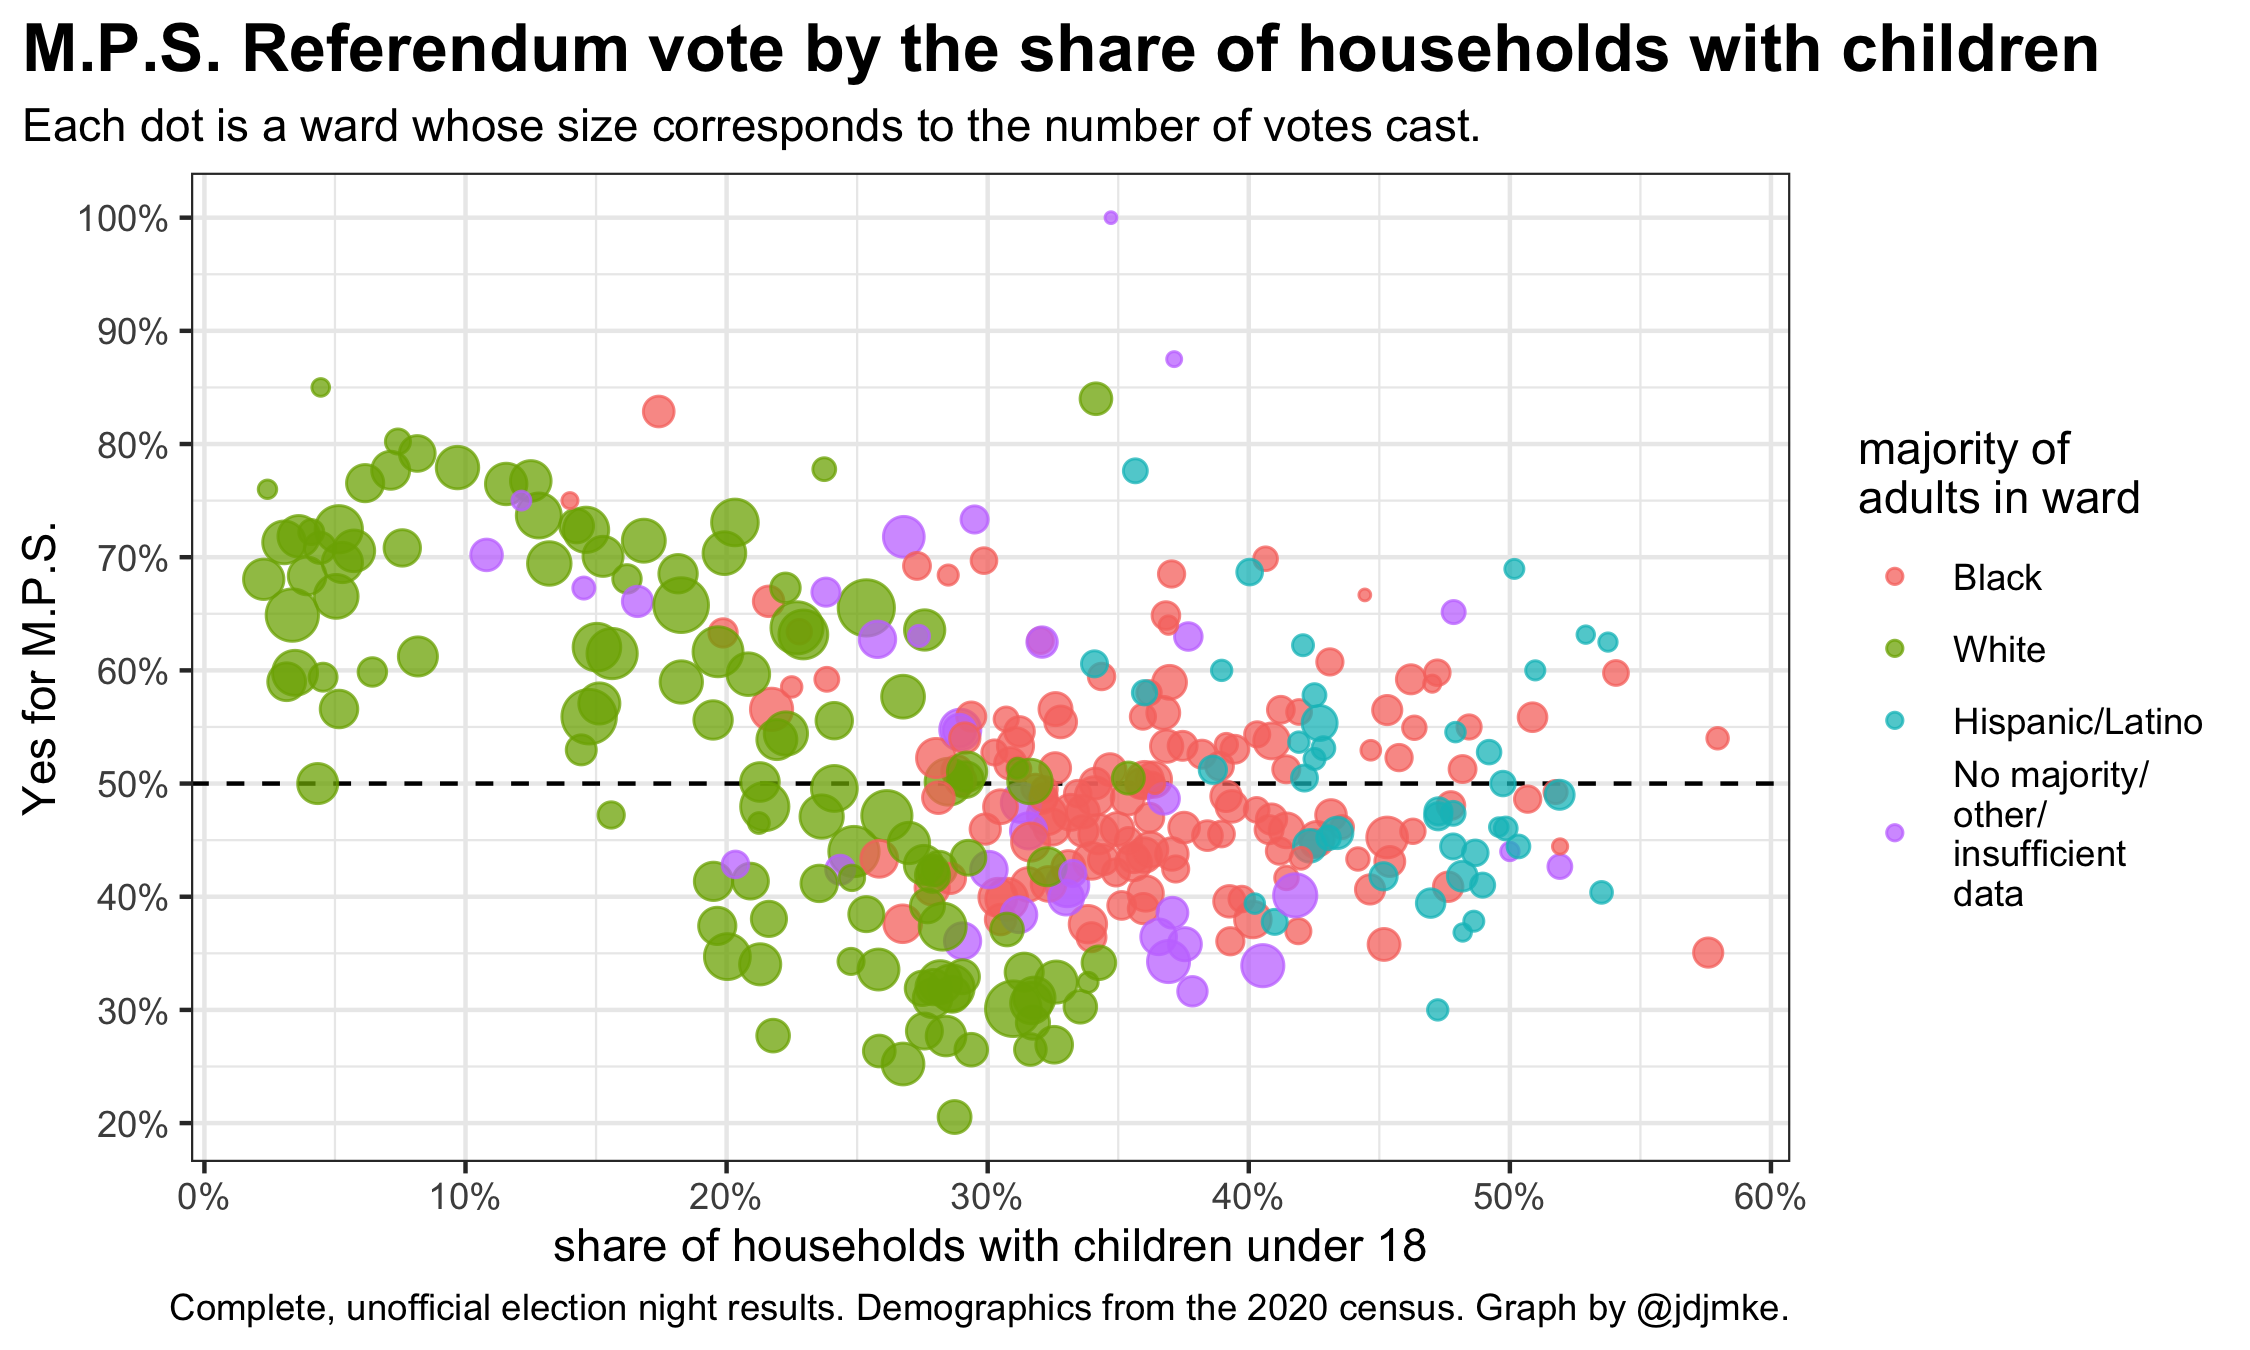
MPS Referendum vote by the share of households with children
Presidential Preference
No candidate remained campaigning against Biden or Trump in their Wisconsin presidential primaries. Still, both candidates put up relatively weak showings.
Across the entire county, Trump received 73.2% from Republican primary voters. Nikki Haley’s defunct campaign still got 16.6%. In 2020 (with no other named candidates on the ballot), Trump won 97% support among Republican primary voters.
Biden received 84.5% of the vote, compared with 12.2% for uninstructed delegates, and 2.5% for Dean Phillips. The last primary featuring an incumbent Democratic president was 2012. In that year, Barack Obama won 99.1% of the Milwaukee County vote, and uninstructed delegates received 0.7%.
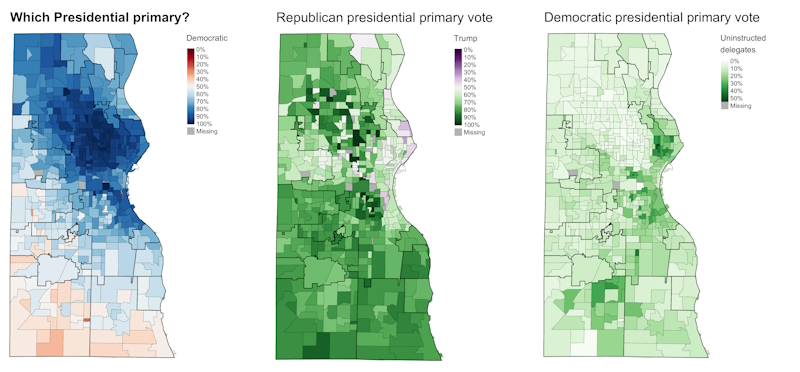
Presidential primary.
The table below shows the primary results in each municipality.
A slim majority of voters participated in the Republican primary in Hales Corners and Franklin. Democrats were in the majority everywhere else.
Among Republican primary voters, Trump generally did best in the southern suburbs, garnering 80% or better in West Milwaukee, Oak Creek, Cudahy, and Hales Corners. Haley did best in the wealthier north shore suburbs, receiving 30% or better among GOP voters in Shorewood, Fox Point, Whitefish Bay, and River Hills.Activists opposing Biden’s handling of the war in Gaza campaigned in support of the “uninstructed delegation” option in the Democratic primary. “Uninstructed” support varied between municipalities with the most support coming in two usually quite different places. Shorewood is the most Democratic municipality in the entire county, and 15% of its Democratic primary participants supported the uninstructed campaign. But “Uninstructed” support was even higher, 16%, in Franklin, one of the county’s most conservative suburbs. In general, uninstructed support was higher in the southern suburbs and lower on the North Shore.
Within the city of Milwaukee, the uninstructed campaign generally performed best in the Riverwest neighborhood, with pockets of significant support scattered elsewhere in the city.
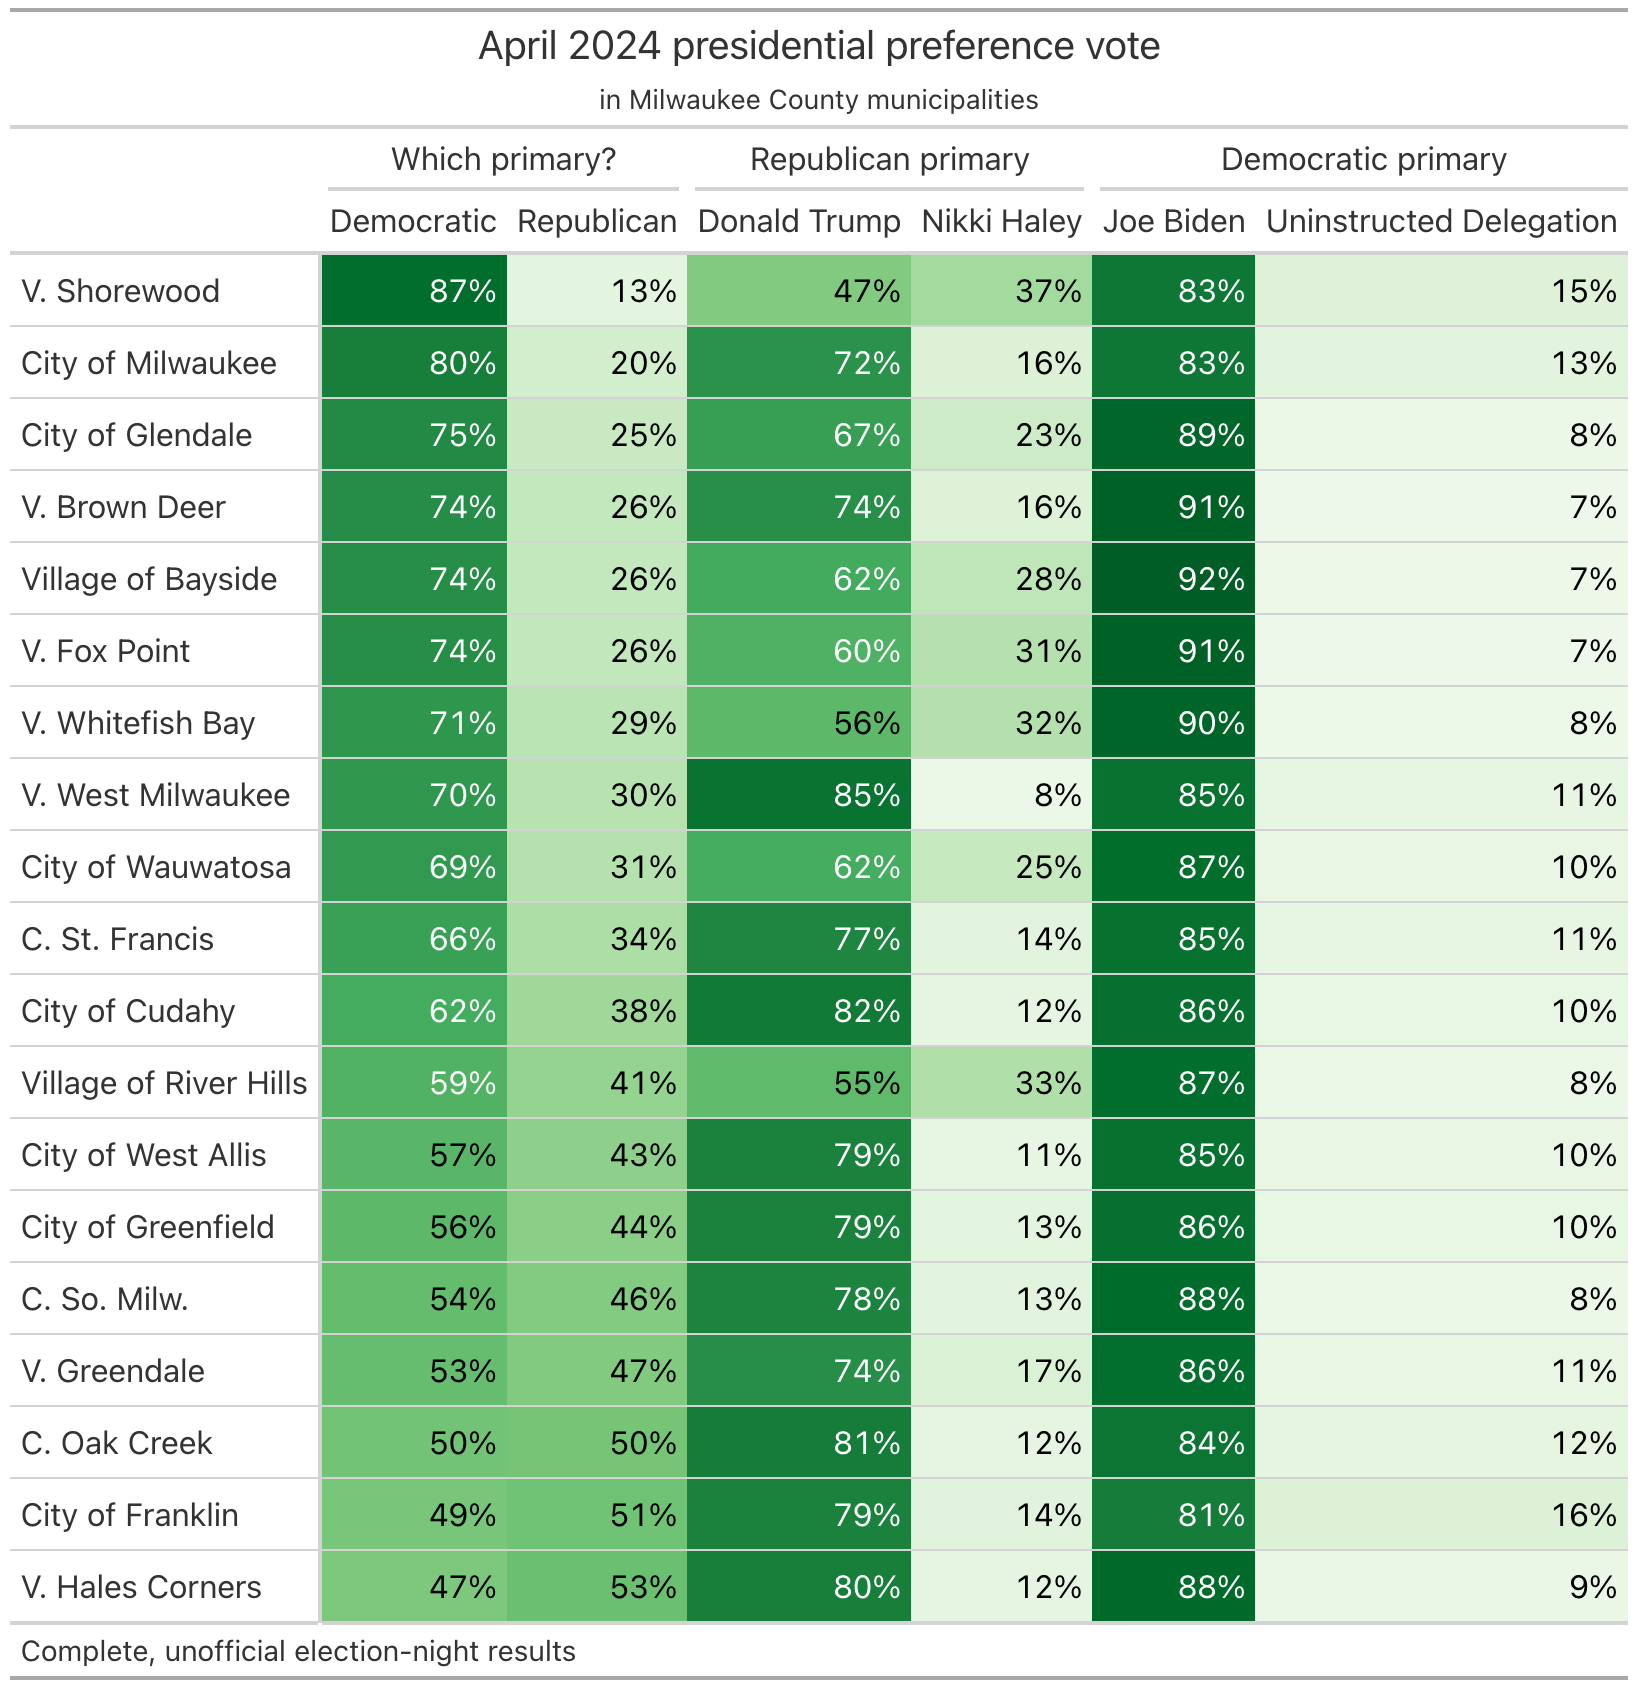
April 2024 presidential preference vote
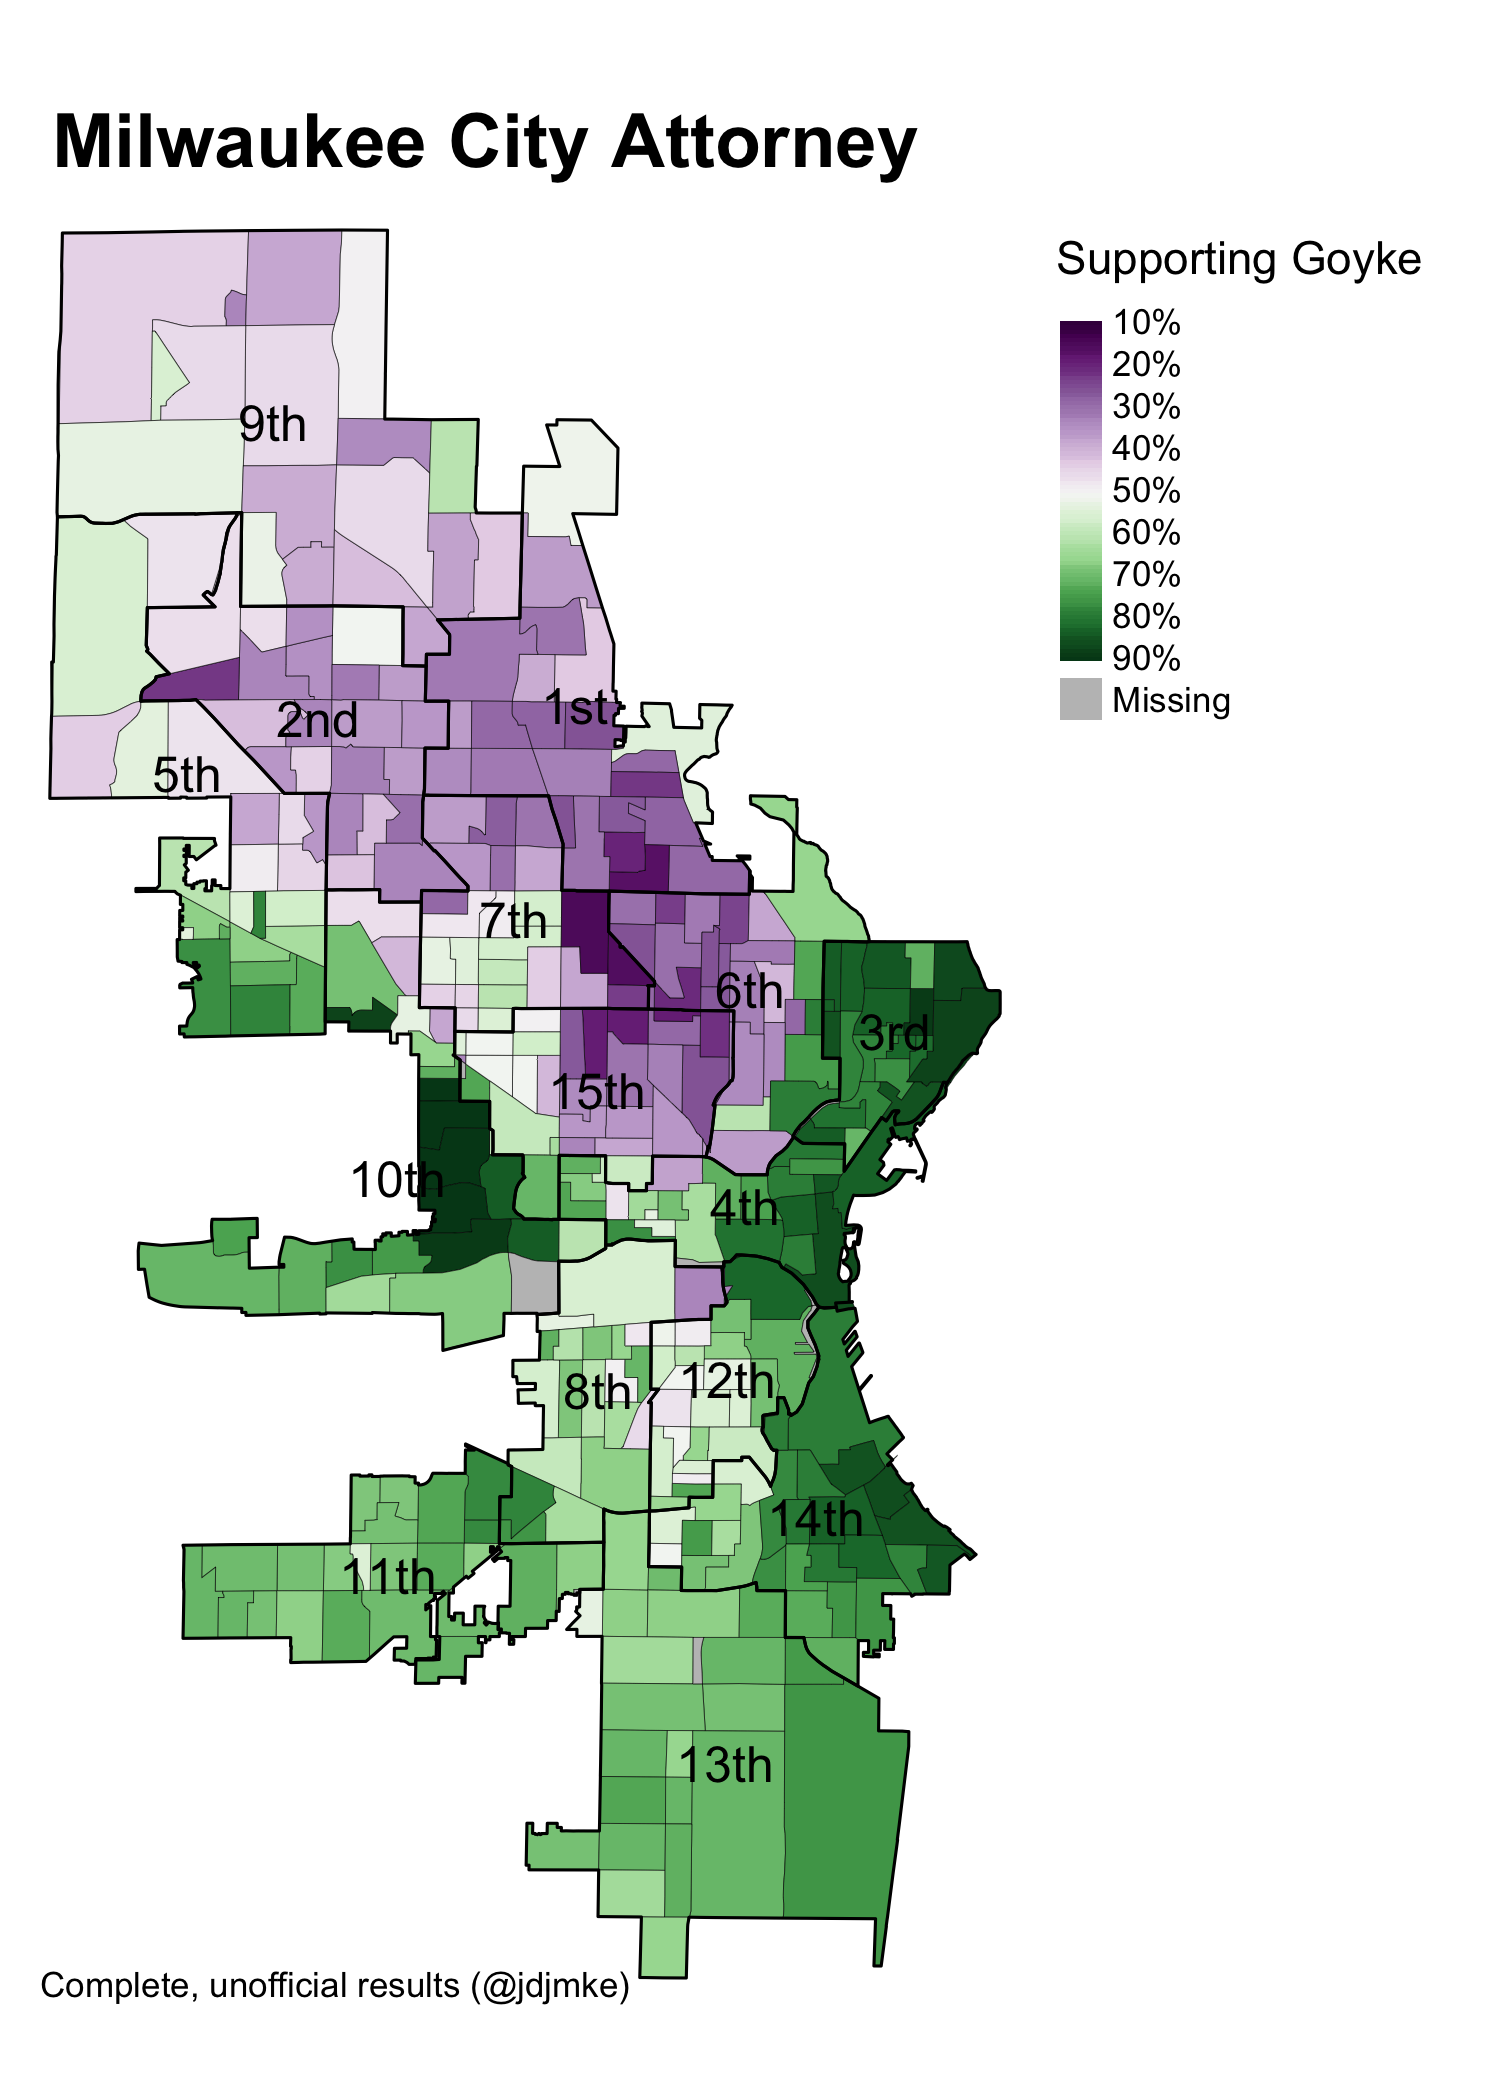
Milwaukee City Attorney
Milwaukee City Attorney
Evan Goyke won 63.3% of the vote, defeating Tearman Spencer in the race for City Attorney. He performed particularly well in the Washington Heights neighborhood and the neighborhoods along the lake. Spencer’s support was mainly limited to parts of the north side of the city.
Goyke carried 211 wards (to Spencer’s 124) and 10 of the city’s 15 aldermanic districts. Goyke won more than three quarters of the vote in the 3rd, 14th, 10th, and 4th districts.
Spencer’s best district was the 1st, where he won two-thirds of the vote, followed by the 2nd, where he won 63%.
Overall Turnout
Interpreting turnout is always challenging, because factors like the mix of elections on a ballot and the competitiveness of those races always vary from one election year to another. Turnout in April 2024 appears to have been middling, compared to recent past cycles for Milwaukee County:
- In 2020, about 210,000 voters, or 41% of registered voters, cast a ballot.
- April 2022 saw about 145,000 voters, or 29% of registered voters.
- This year, 165,000 voters participated, about 34% of those registered.
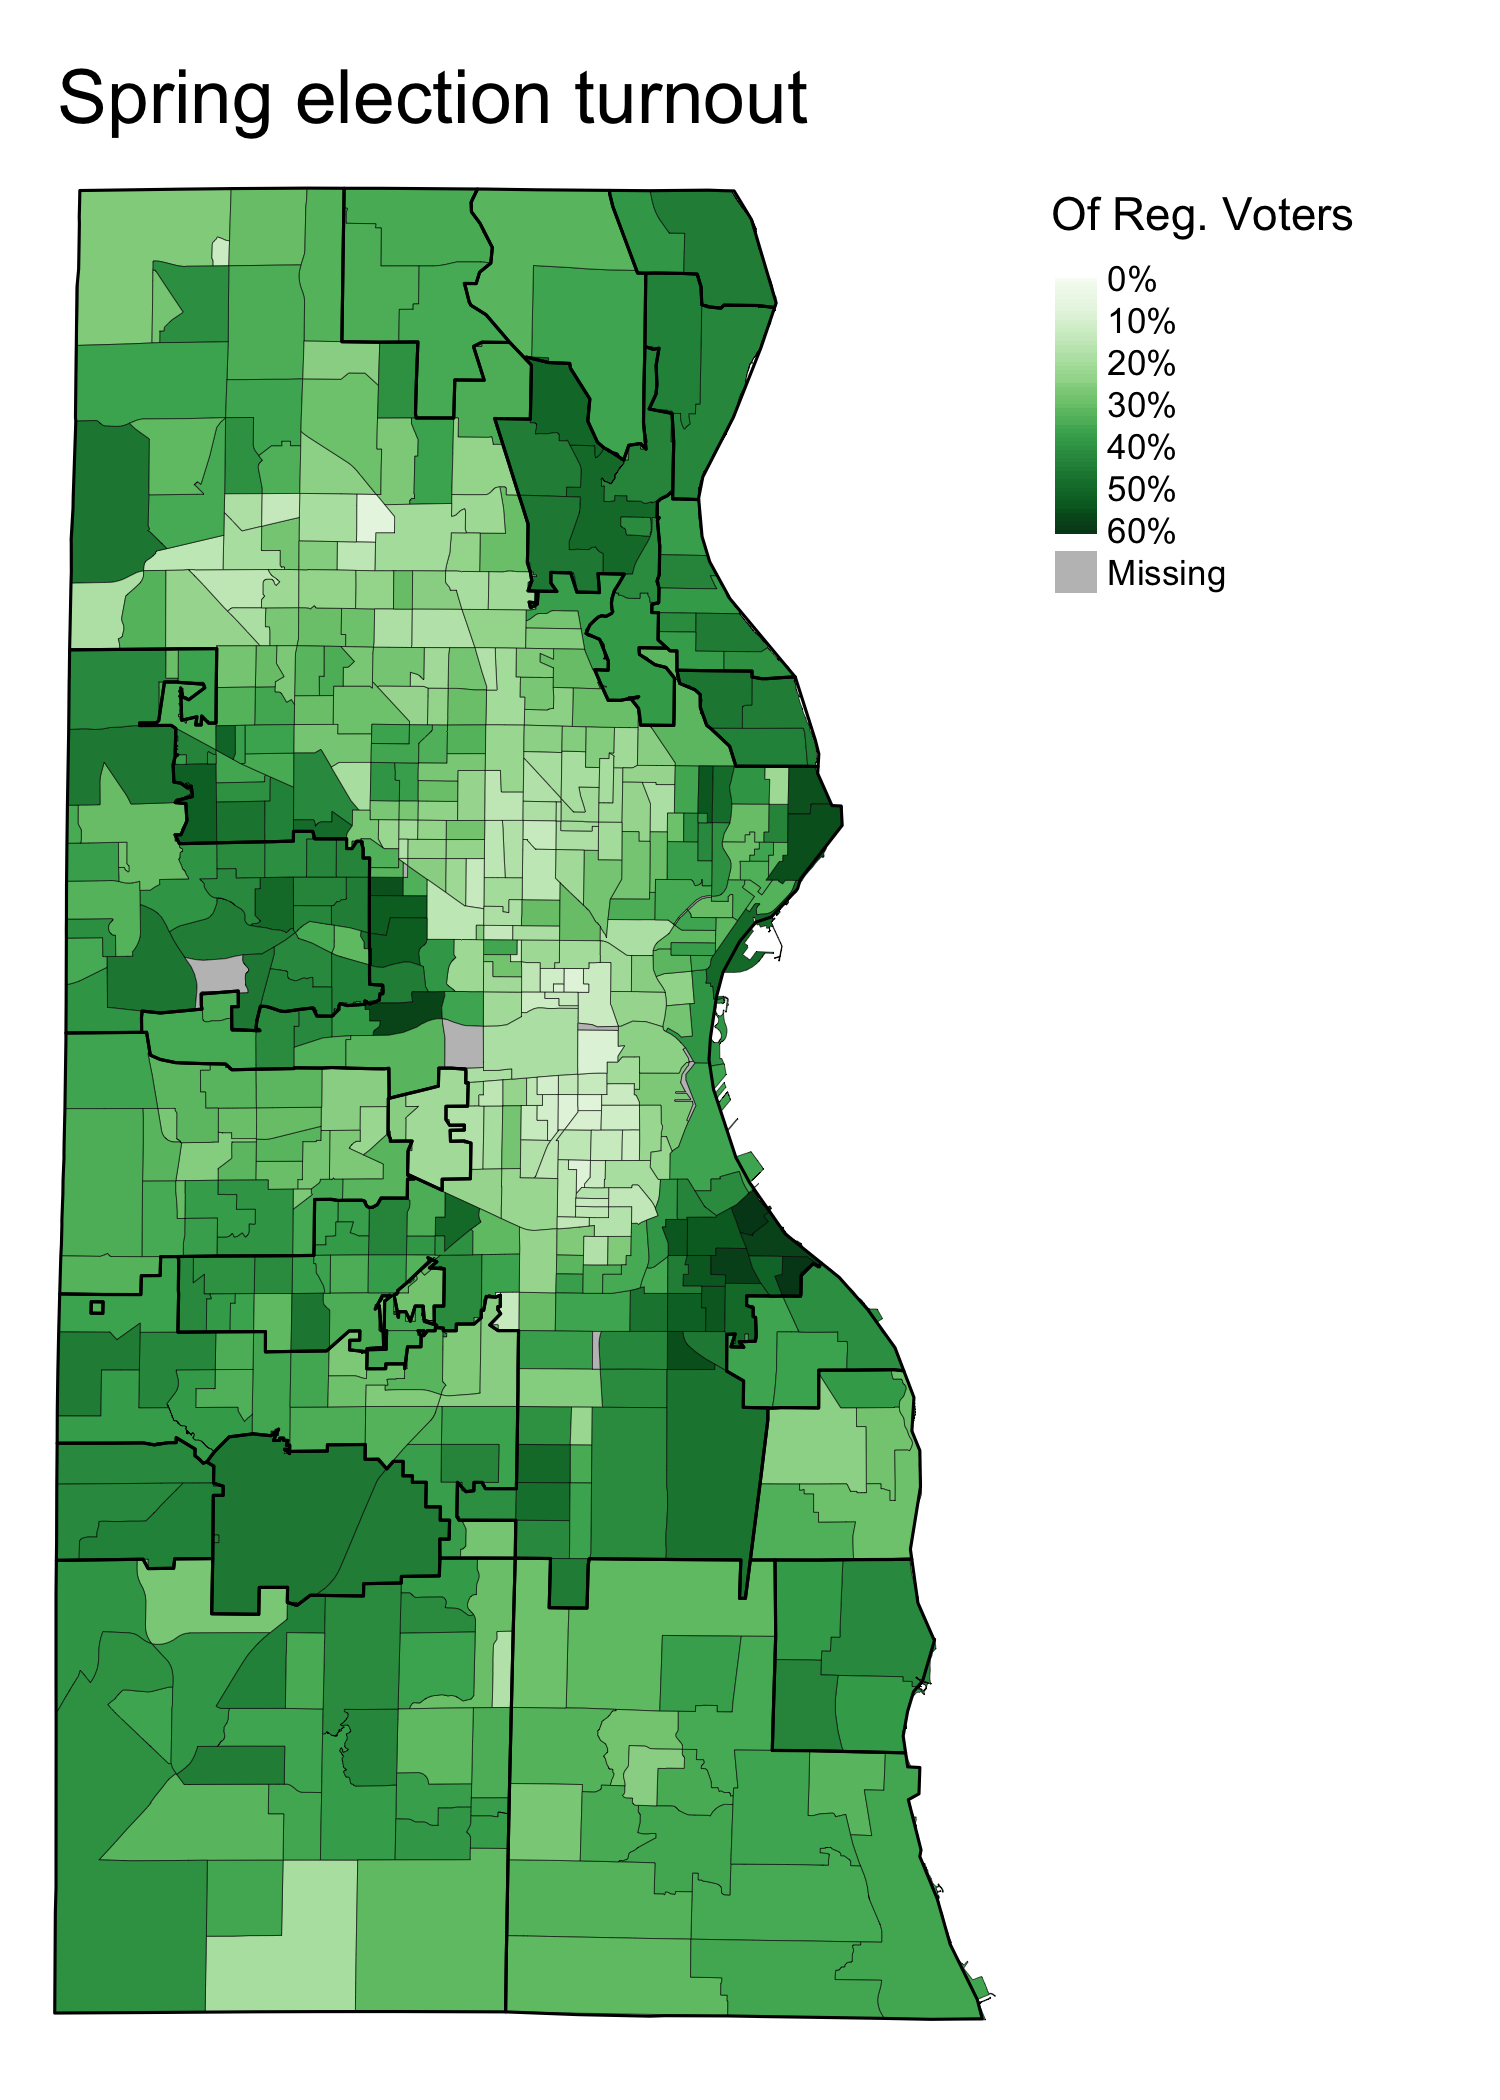
Spring election turnout.
As a share of registered voters, turnout was highest on the North Shore. The top-5 municipalities were Glendale, Greendale, Shorewood, Fox Point, and Bayside, among which turnout ranged from 42.1% to 45.4% of registered voters.
The lowest turnout came in West Milwaukee (22.6%), Cudahy (30.7%), West Allis (31.4%), and Milwaukee (31.6%).
Political Contributions Tracker
Displaying political contributions between people mentioned in this story. Learn more.