
Ranking The 7 Proposed Legislative Maps
7 redistricting maps were submitted to state Supreme Court. Which is best and why?
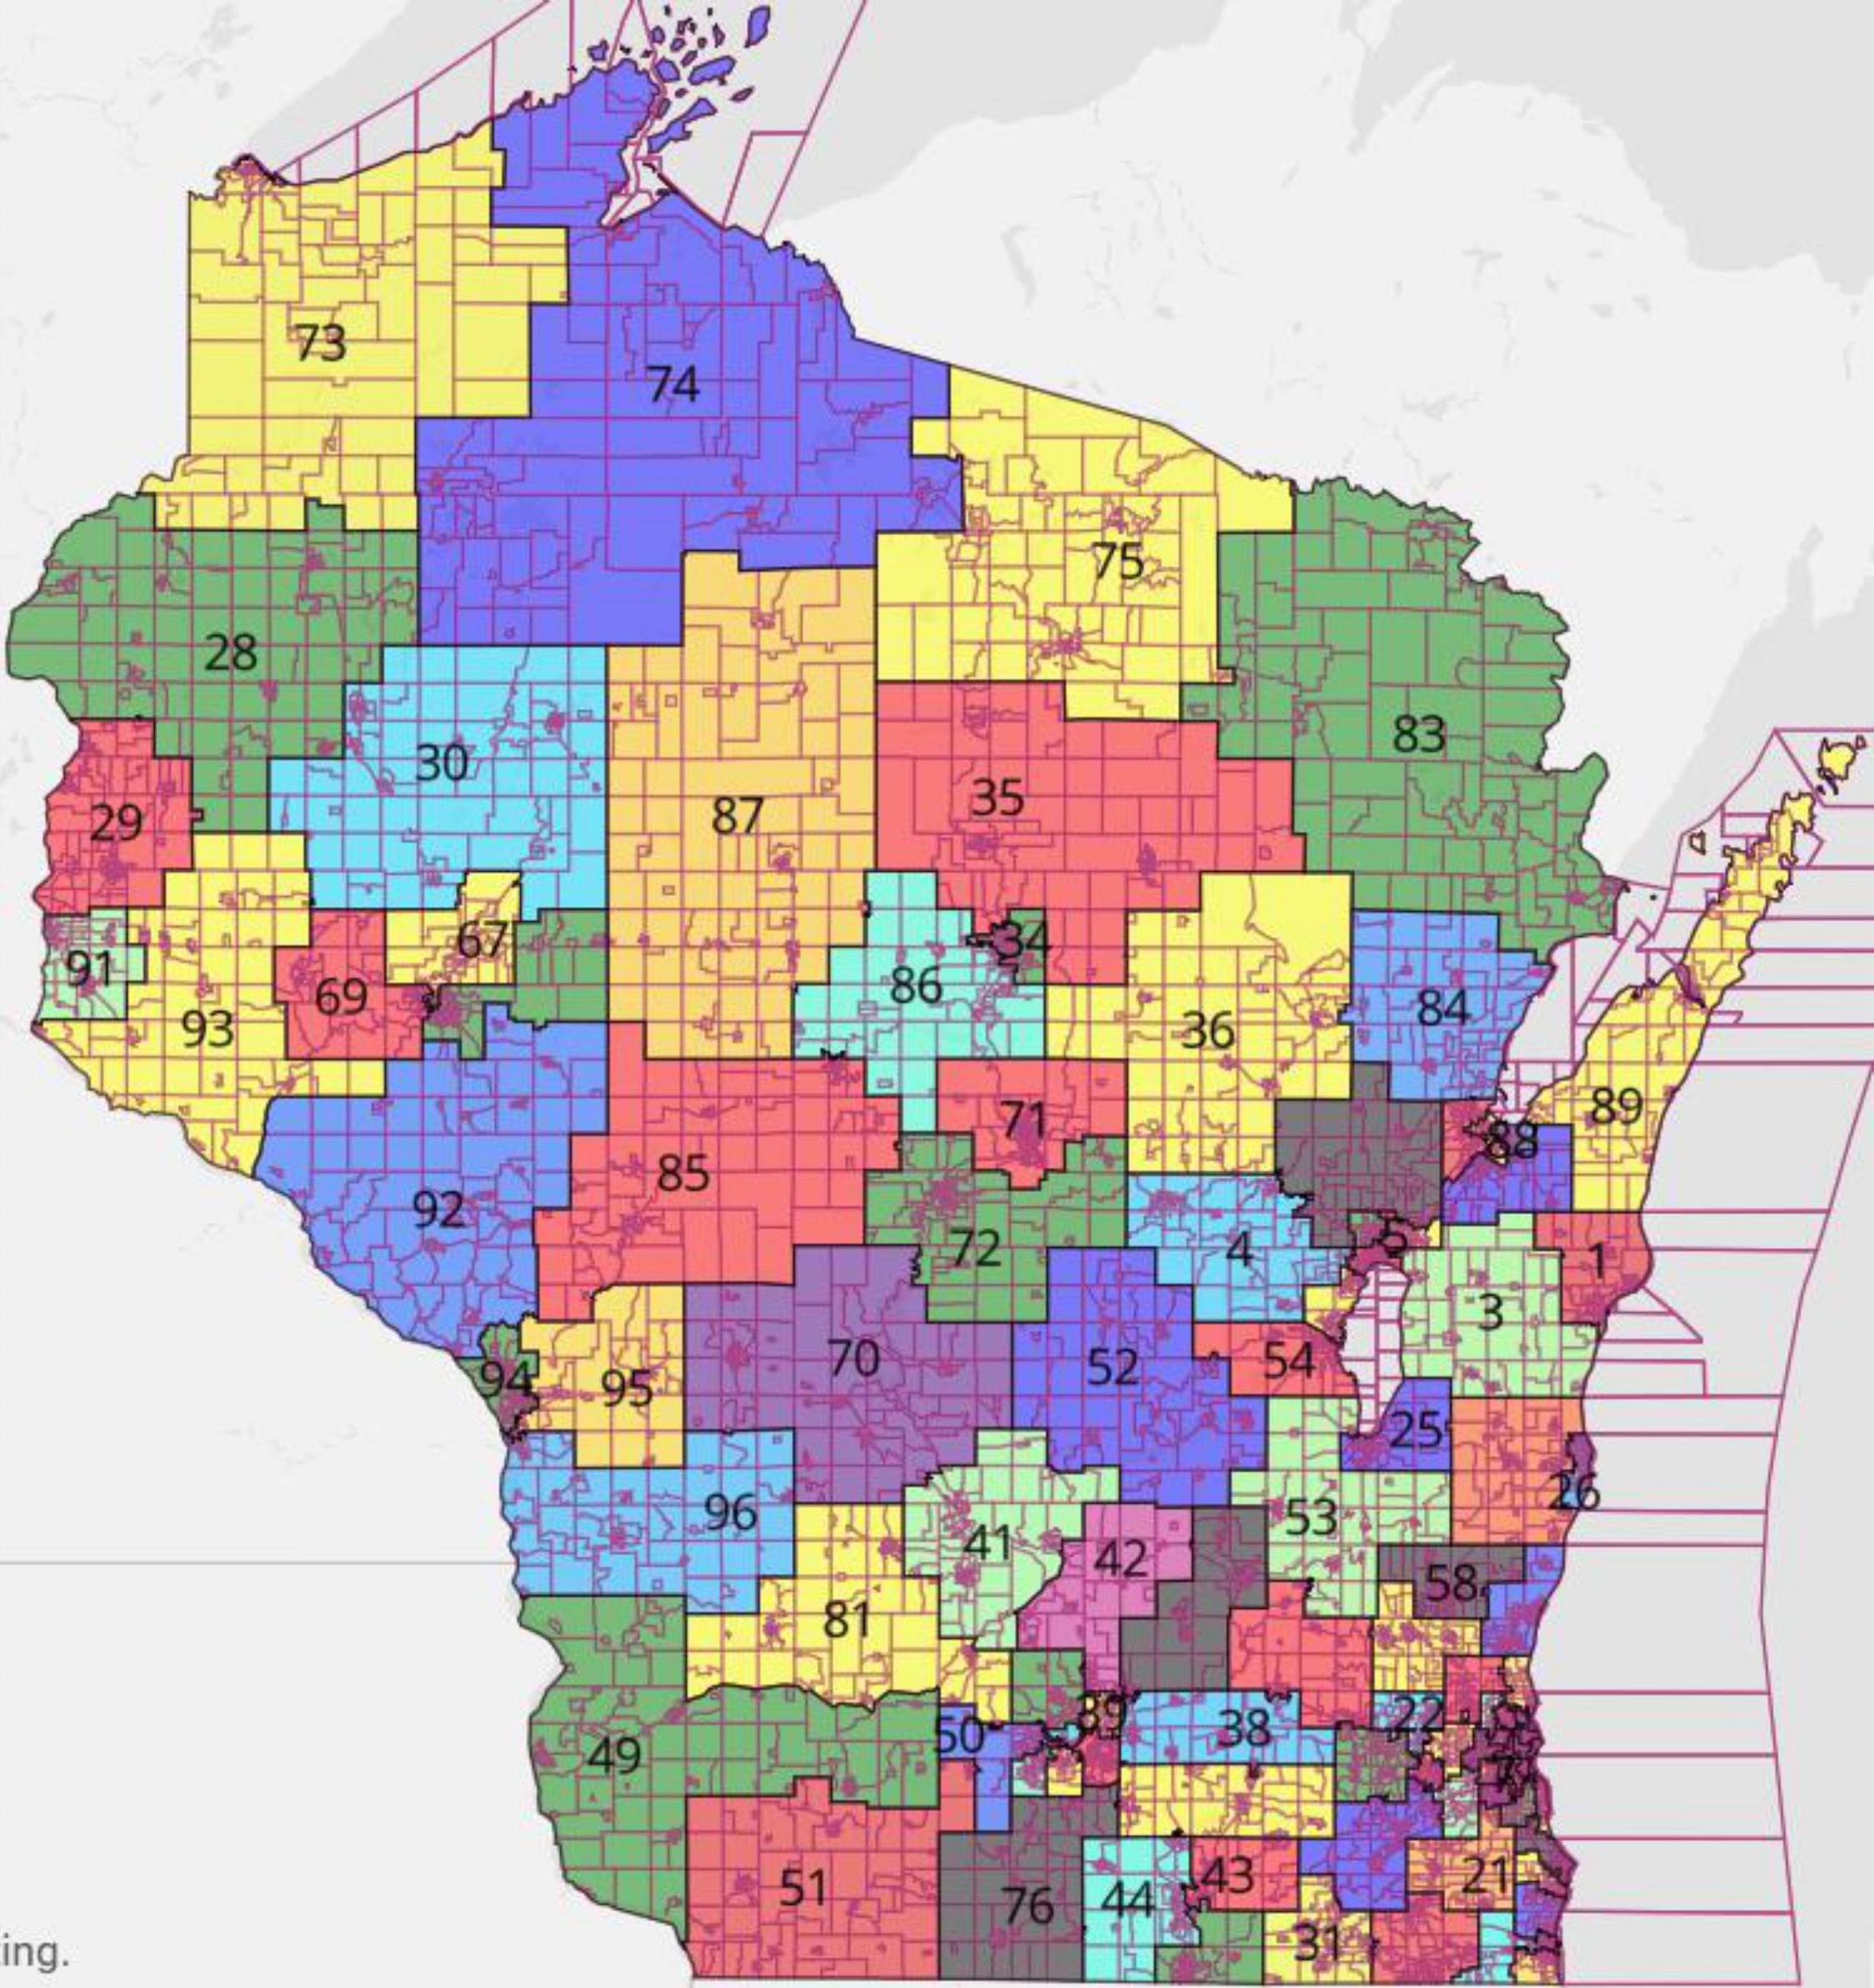
Matt Petering’s Assembly Map. Image from Dave’s Redistricting.
Seven different district maps were submitted to the Wisconsin Supreme Court in response to the court’s decision that the current districts are unconstitutional. The current map violates the Wisconsin Constitution’s requirement that the districts be contiguous because of district “islands,” parts of districts that are surrounded by other districts.
There are several tools to measure whether a district map is gerrymandered to favor one party over another. One that is the “efficiency gap.” It is based on the observation that there are two kinds of “wasted votes.” The first is all the votes that exceed the number to win in a district election. The second are all the votes for candidates who did not win their elections. Successful gerrymandering consists of designing a district map in which the other party wastes more votes than one’s own party.
It does this through “packing and cracking.” Packing consists of creating a few districts with an overwhelmingly number of supporters of the other party. This allows one to add enough voters to other districts to give them a safe majority of one’s own voters. That’s what Republicans did in Wisconsin.The next graph shows the efficiency gaps for the seven maps that were proposed to the Supreme Court. These were calculated by the commonly used website Dave’s Redistricting. The efficiency gaps for Assembly districts are shown in green; those for state Senate districts are shown in rust. By custom, efficiency gaps that favor Republican candidates have positive values; those favoring Democrats are shown as negative numbers.
Starting at the left-hand side of the graph below, the first represents the efficiency gap for the present district maps. This is taken from the brief from the Wisconsin Legislature and Republican Senators. The intent of this brief is to protect the current gerrymander by only making the changes necessary to eliminate the district islands. (In fact, their submission links to the present maps, not maps resulting from these changes.)
The second pair of columns comes from a brief by the Johnson Intervenors, many of the same people whose suit resulted in the current gerrymander. This brief, developed by the conservative Wisconsin Institute for Law and Liberty, first argued that the court should adopt the map proposed by the Wisconsin Legislature. However, it also included an alternative map. The brief claims that this alternative map was developed without using data on voting patterns. Although a bit less gerrymandered, this would still make it nearly impossible for Democrats to challenge the Republican domination of the Legislature.
The other five maps on the graph all have the aim of reducing or eliminating the gerrymander. They come from Gov. Tony Evers, Senate Democrats, the Wright group (sometimes called the Citizen Mathematicians), the Clarke group represented by Law Forward, and UWM faculty member Matt Petering.
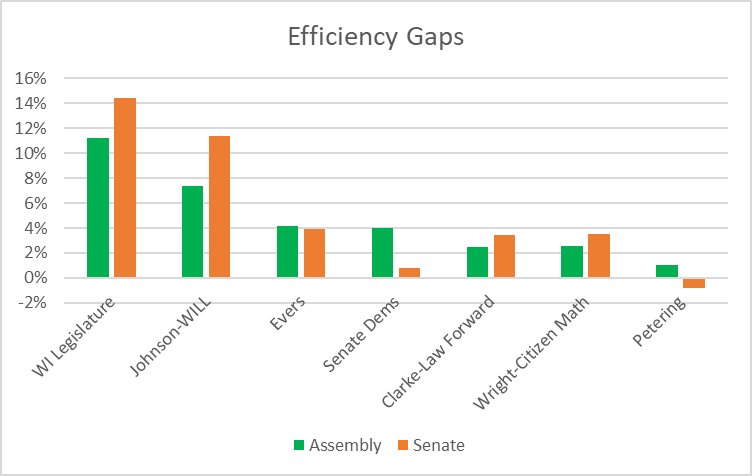
Efficiency Gaps
In addition to proportionality, Dave’s Redistricting offers scores on four additional measures: the number of competitive districts, opportunities for minorities to elect representatives, compactness, and avoiding splitting counties.
The next graph shows scores for six of these plans from Dave’s Redistricting using a scale of zero to 100, where bigger is better. (The scores from the Senate Democrats were not included, because I could not find a link to Dave’s for this plan.)
I find it surprising that this graph does not suggest that there is any trade-off between proportionality and the other four measures. One might expect that increased proportionality would come at the cost of some other desirable characteristic.
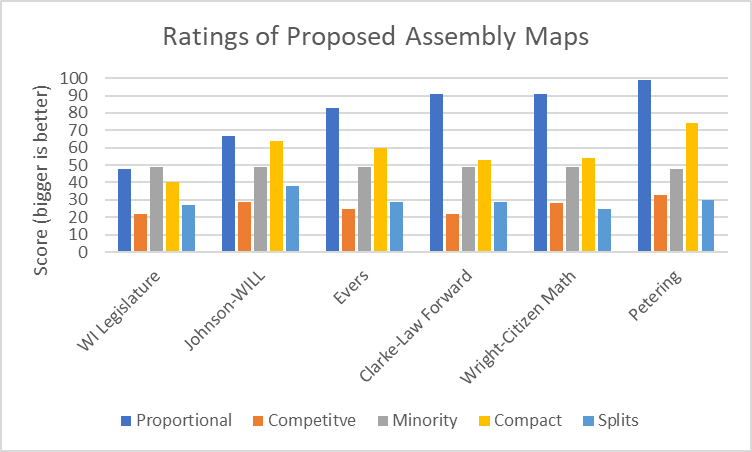
Ratings of Proposed Assembly Maps
The next graph the scores for the senate maps from the same six groups. Note that there is no evident trade-off between Senate and Assembly maps. Since each senate district is required to contain three Assembly districts, one might expect that optimizing one might result in a lower score in the other. In general, better scores for the assembly maps are accompanied by better senate scores.
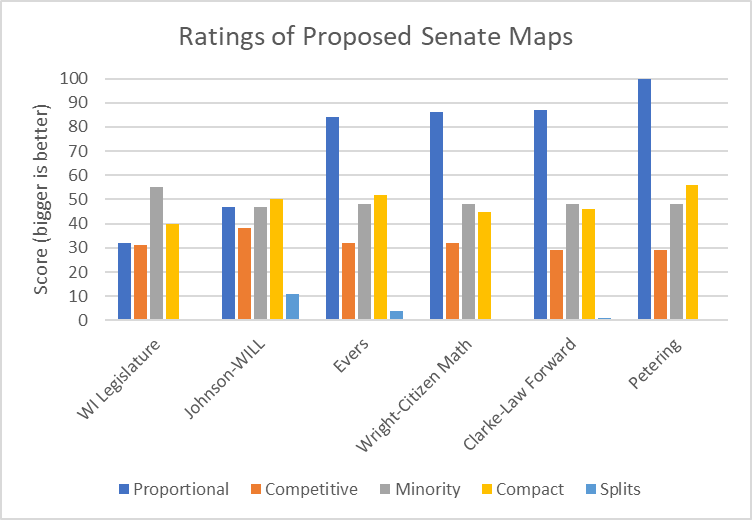
Ratings of Proposed Senate Maps
One could argue that the Petering map is the most democratic, both in terms of the efficiency gap and factors such as competitiveness and compactness of districts. However the Supreme Court has now ruled that this map cannot be considered because Petering was not invited by the court to submit one. With that in mind, the two best maps would be the Clarke-Law Forward map and the Wright-Citizen Math map. Both have about the same efficiency gap, of just over 2% for the Senate and just over 3% for the Assembly and are about the same on criteria like competitiveness and compactness of districts and minority voting power. All four of the other maps to the left of the Petering map are greatly superior to the two gerrymandered Republican maps, with the Evers map the least preferable alternative.
Entrenching one group in power through gerrymandering threatens democracy. Why then do three of our seven justices or an organization that purports to advocate for law and liberty defend a continuation of Wisconsin’s gerrymander?
Perhaps the most concise explanation comes from Justice Brian Hagedorn:
In a politically charged world, the judiciary should be a bulwark against the tribalism so prevalent among us. We should neutrally and consistently apply our rules of judicial process, no matter where that leads us. We should have no favored litigants or preferred outcomes. At the end of the day, the majority acts not to vindicate some legal principle, but to achieve a long sought-after goal: the redistribution of political power in the Wisconsin legislature. Rather than start with the law and see it through to the end, the court starts with the goal and works backwards to justify it. This is not faithful judging, and I will have no part of it.
I chose Hagedorn because he strikes me as the most thoughtful and independent of the so-called “conservative” justices, but it seems to me that he has it precisely backwards. By choosing to base the district map on the 2011 gerrymander, the court made the Republican gerrymander their own. The 2021 court majority enlisted in the effort to entrench one party in power. It is ironic that supporters of a map clearly advantaging the Republican party justify that position by referring to the need for nonpartisan courts.
Note: an earlier version of this column recommended the Petering map, some hours before the court ruling disqualified it. The revised column takes account of that ruling.
More about the Gerrymandering of Legislative Districts
- Without Gerrymander, Democrats Flip 14 Legislative Seats - Jack Kelly, Hallie Claflin and Matthew DeFour - Nov 8th, 2024
- Op Ed: Democrats Optimistic About New Voting Maps - Ruth Conniff - Feb 27th, 2024
- The State of Politics: Parties Seek New Candidates in New Districts - Steven Walters - Feb 26th, 2024
- Rep. Myers Issues Statement Regarding Fair Legislative Maps - State Rep. LaKeshia Myers - Feb 19th, 2024
- Statement on Legislative Maps Being Signed into Law - Wisconsin Assembly Speaker Robin Vos - Feb 19th, 2024
- Pocan Reacts to Newly Signed Wisconsin Legislative Maps - U.S. Rep. Mark Pocan - Feb 19th, 2024
- Evers Signs Legislative Maps Into Law, Ending Court Fight - Rich Kremer - Feb 19th, 2024
- Senator Hesselbein Statement: After More than a Decade of Political Gerrymanders, Fair Maps are Signed into Law in Wisconsin - State Senate Democratic Leader Dianne Hesselbein - Feb 19th, 2024
- Wisconsin Democrats on Enactment of New Legislative Maps - Democratic Party of Wisconsin - Feb 19th, 2024
- Governor Evers Signs New Legislative Maps to Replace Unconstitutional GOP Maps - A Better Wisconsin Together - Feb 19th, 2024
Read more about Gerrymandering of Legislative Districts here
Data Wonk
-
Who Do You Trust to Conduct Elections Fairly?
 Apr 6th, 2026 by Bruce Thompson
-
Is Non-Citizen Voting a Real Threat to Elections in Wisconsin?
Mar 18th, 2026 by Bruce Thompson
-
How Global Climate Change Affects Milwaukee
 Mar 11th, 2026 by Bruce Thompson


The conservative majorities in both the 2012 and 2022 decisions violated the principles Hagedorn articulated in his 2023 dissent. In fact, Hagedorn fails to see how he violates his own reasoning. One could accuse Hagedorn of being disingenuous.
Hagedorn is an “originalist,” like many members of the Federalist Society. The problem with “originalist” justices is, in their rulings, they don’t consider historical context or judicial precedents. More egregious is their refusal to consider the “original” intent of the authors. In essence they rewrite intent to mirror their reactionary inclinations. This smacks of judicial activism; a charge RRRs (radical reactionary republicans) like to lob against progressive judges.
I’m very glad you quoted Hagedorn. This extract: “Rather than start with the law and see it through to the end” begs the question: what law is being “started” with? Is it the earlier legislative maps? If so, why is that the starting point? It would seem the more appropriate starting point is the State Constitution and applicable State Statutes.
The major challenge(s) in this entire process is the complexity of guidelines/standards that need to be applied for making a decision. It wouold be helpful going forward to have all these guidelines reviewed and hopefully reduced to a reasonable number of variables that need to be applied. Simplicity and the “bright line” should be guiding principles..