
Why That ‘Iowa’ Redistricting Plan Was Unfair
Wisconsin Republicans' plan did not provide political proportionality.
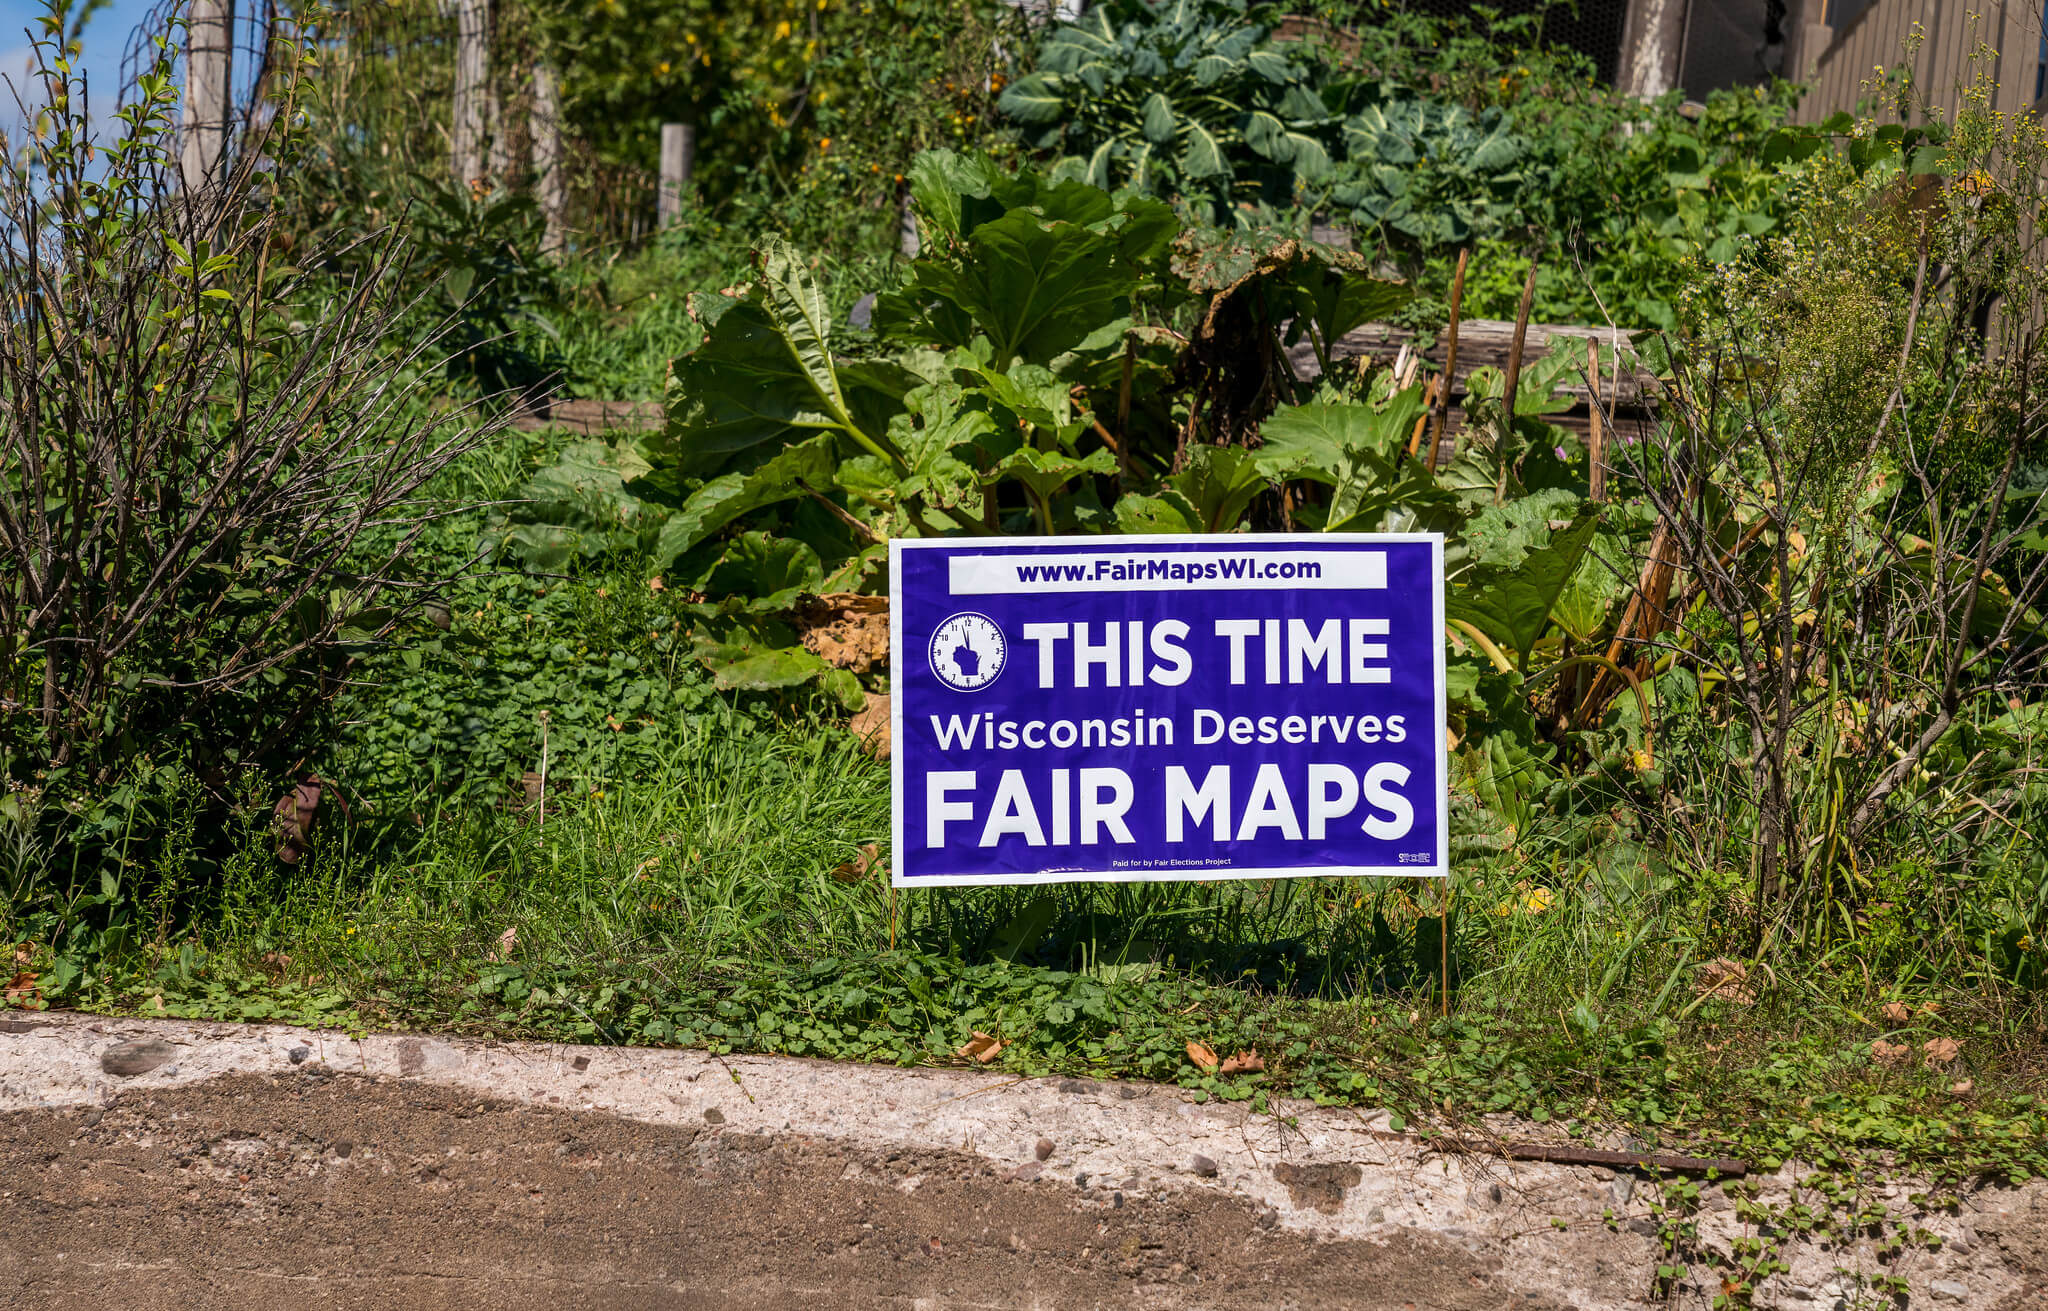
A yard sign in Mellen, Wisconsin reads: “This Time Wisconsin Deserves Fair Maps,” paid for by the Fair Elections Project, FairMapsWI.com. Wisconsin Fair Maps Coalition by Tony Webster (CC BY 2.0)
For many years, Wisconsin Democrats, reacting to the state’s highly gerrymandered legislative districts, have pointed to Iowa as a possible model for Wisconsin. Thus, it came as a surprise that opposition to Assembly Bill 415 was greeted with Democratic opposition. AB 415 was modeled on the Iowa redistricting system, Wisconsin Republicans said.
Under this bill, the primary responsibility for designing district maps would be given to the nonpartisan Legislature Reference Bureau (LRB). The LRB would design proposed maps and send them to the Legislature for its approval. If the Legislature did not approve the maps, the LRB would repeat the process over again, taking in mind the reasons for their rejection. This process could be repeated up to three times, assuming that none of the maps are to the Legislature’s liking.
One concern I have is the history of Wisconsin Republicans attacking nonpartisan governmental bodies when they do not do what these Republicans want. The nonpartisan Government Accountability Board (GAB) was shut down because it was investigating credible evidence that Scott Walker coordinated his campaign with supposedly independent outside groups. The executive director of the GAB’s replacement, the Wisconsin Elections Commission is currently under attack because of unhappiness that Donald Trump was unsuccessful in his attempts to reverse the 2020 Wisconsin election results. Will a similar fate await the LRB if its district maps reduce the number of Republican seats in the Legislature?In his analysis of the proposal, Marquette Law’s John D. Johnson focuses on the uncertainty as to what happens after the third unsuccessful try: “Does this mean that the legislature could simply run out the clock on LRB plans, before passing one entirely of their own devising?”
AB 415 also establishes a redistricting advisory commission. It is unclear to me what role that commission is expected to play.
But the biggest problem with the bill is the redistricting standards and what they do not include. The standards include conformance to the federal Voting Rights Act and any other applicable federal law, approximately equal district populations, that district boundaries coincide with ward boundaries and, to the extent possible to boundaries of political subdivisions, and that district be compact and contiguous.
But a glaring omission in the bill’s list is proportionality—the idea that the number of districts won by each party should be proportional to that party’s share of the statewide vote. The latest map and its predecessor are notorious for violating that principal. The violation is deliberate: the maps were deliberately designed to entrench Republicans in power, not to enhance democracy.
Another missing standard is competitiveness. In most districts in Wisconsin today, the decision of who wins the seat is determined by the primary election rather than the general election.AB 415 includes a ban on the use of data on the political affiliations of registered voters, previous election results, and demographic information. Presumably, this prohibition would have the effect of ruling out highly partisan maps like the current maps and their predecessors.
Banning the use of election data in redistricting would guard against the most egregious gerrymanders, such as those adopted after the 2010 and 2020 Censuses. But it would make proportional maps impossible. Without this data, how would one know whether a map was proportional? (The Iowa plan created decades ago may not have taken into account proportionality, but Wisconsin is in a very different place today, with grossly gerrymandered districts and a resulting massive Republican advantage in the Legislature that makes is imperative that this political unfairness be addressed.)
Consider the evaluation by the Princeton Gerrymander Project of SB 621, the plan created by the Legislature and adopted by the state Supreme Court in 2021 for Wisconsin assembly districts. The illustration below shows part of its report. The evaluation gives the most weight to proportionality, calling it “partisan fairness.” Commenting that SB 621 offered “Significant Republican advantage,” the report gave the plan an overall grade of F, as well as an F for partisan fairness.
Why did SB 621 earn a failing grade? The illustration offers an explanation. The Princeton project had their computer generate over 200,000 maps (vertical scale). The number of Democratic districts out of 99 in the state Assembly is shown on the horizontal scale with the distribution of Democratic voters shown in the probability plot in the space marked by an “A.” From the probability graph it appears that the most common number of Democratic districts in the computer-generated districts was around 46 or 47.
Where does SB 621 map fit in? Its location on the scale is shown by the downward point arrow (or triangle). The number of districts with a Democratic orientation is 40. This is substantially less than predicted by the computer-generated districts, confirming yet again that SB 621’s maps were aimed at keeping the Legislature in the control of Republicans, not by some map-making requirement.
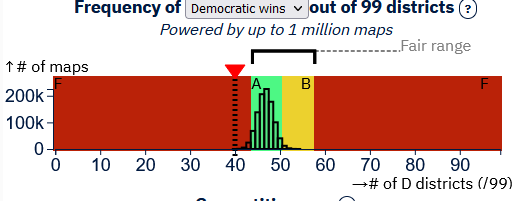
Frequency of Democratic wins out of 99 districts
The next illustrations summarize the same analysis of the final Assembly map issued by the People’s Map Commission. Now the arrow pointing to the map’s estimate of Democratic oriented districts points to 49 or 50 out of 99.
As a result, the People’s map rates an overall grade of A, as well as an A for partisan fairness, with the Princeton group commenting that it offers “No advantage to either party.”
Turning to another feature, Geographic Features, the People’s map rates a C. Comments include “Compact districts, typical number of county splits.” This contrasts with the map in SB 621, which earns an F in “Geographic Features” because of “non-compact districts” and “more county splits than typical.”
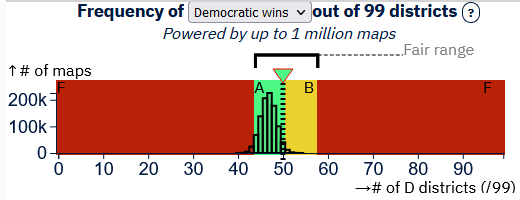
Frequency of Democratic wins out of 99 districts
The Peoples’ map has 17 competitive districts (defined as those where the estimated Democratic and Republican vote share percentages is between 46.5-53.5%). This compares to just 13 with the SB 621 map.
The probability function shown in the two illustrations above carries with it a warning to those supporting fair maps. Just getting rid of the deliberate bias towards Republican control evidenced by the Wisconsin gerrymander will not be sufficient to gain proportional maps.Matthew Petering, a member of the engineering faculty at the UW-Milwaukee, reports a similar conclusion in his statistical analysis. While it is possible to create proportional legislative maps for Wisconsin, unless that became part of the goal and election data was included such maps don’t magically appear. The following graph summarizes the results of one of his experiments in which he created 1,000 Assembly maps but did not use election data.
By far the most common maps generated had 42 or 43 Democratic districts. None had 46 or more. While certainly much better than today’s, none would give a chance of gaining state control to Democrats.
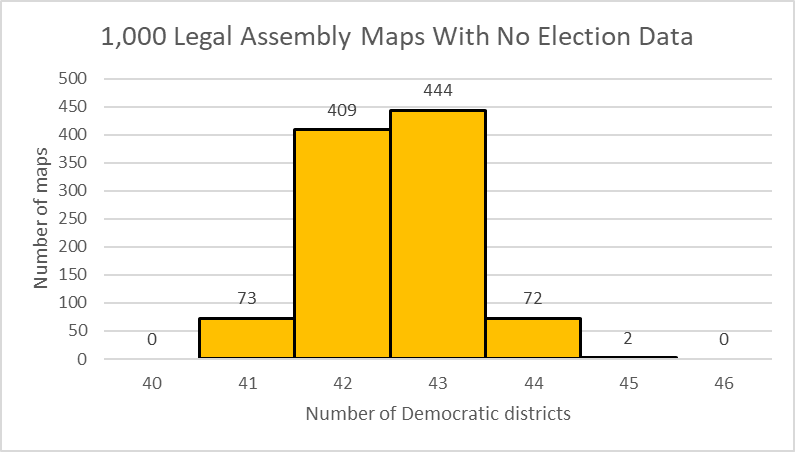
1,000 Legal Assembly Maps With No Election Data
In the recent spring election, Janet Protasiewicz won 55.5% of the votes. Yet she lost a majority of Assembly Districts by 47 to 52. This is bad democracy in Wisconsin. It is analogous to a rule stating that a candidate for governor in Wisconsin could win only if receiving at least 55.5% of the vote.
Data Wonk
-
Who Do You Trust to Conduct Elections Fairly?
 Apr 6th, 2026 by Bruce Thompson
-
Is Non-Citizen Voting a Real Threat to Elections in Wisconsin?
Mar 18th, 2026 by Bruce Thompson
-
How Global Climate Change Affects Milwaukee
 Mar 11th, 2026 by Bruce Thompson


Excellent analysis. I was wondering why the Dems were rejecting Vos’s “Iowa Plan”. This clears it up.