Measuring Wisconsin’s Economy
The data give a mixed picture of the state's economy, with stagnant labor force growth.

100 Dollar Bill. Photo by Dave Reid.
Data on the Wisconsin economy give a mixed picture of the Wisconsin economy. An earlier Data Wonk column discussing the state’s huge budget surplus pointed to one indicator of an economy that was running very hot and generating large tax revenues.
In 1986 the Legislature passed a law attempting to rectify the state’s lack of a rainy-day fund that could help fill gaps in tax revenues in years when the economy is weak. In years when the state runs a budget surplus, the law said, half the surplus would go into the rainy-day fund until the fund contained at least 5% of the amount in the state budget.
For 30-plus years following the law’s passage, the Wisconsin rainy-day fund stayed anemic; whatever funds were generated in surplus years were quickly consumed in budget-deficit years. In the past four years, however, the situation dramatically changed. The models used to predict the state’s revenue from taxes under-predicted. The result was a cumulative budget surplus of $5.3 billion, or $6 billion if the present rainy-day fund is included.
In the absence of increased tax rates, an unexpected increase in tax revenue must come from increased economic activity. In the remainder of this column, I look at some other economic datasets. Do they confirm or contradict the story told by state budget surpluses?
The next chart shows the gross domestic product for the US (in orange) and Wisconsin (in green) in 2012 dollars. The numbers on the left apply to the US GDP (in billions) while those on the right (in millions) apply to Wisconsin. GDP values are released for quarters. The US figures go through the third quarter of 2022; for Wisconsin, they run through the second quarter of 2022.
The chart shows dips in the the GDP for both the US and Wisconsin—the first during the Great Recession around 2009 with its very slow recovery. The second very sharp dip and quick recovery was caused by the COVID-19 pandemic. During this period, the Wisconsin GDP closely tracks the national GDP.
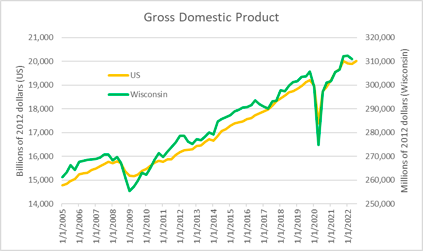
Gross domestic product
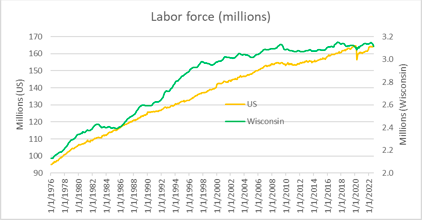
The next graph shows the labor force in the nation and Wisconsin. The labor force is defined as the total number of people with jobs plus those who are actively looking for jobs. Note that Wisconsin’s labor force grew strongly for decades, from the 1970s and into this century, but then leveled off. Since the eve of the Great Recession in 2008, Wisconsin’s labor force has been essentially flat—3.13 million in 2009 and 3.11 most recently.
Current projections are that the Wisconsin labor force will continue to shrink as members of the baby boom generation reach retirement age. This is an argument for increasing the number of slots for legal immigrants and to accelerate the process of evaluating applications.

Labor force (millions)
Despite a flat—and projected shrinking–labor force, Wisconsin’s labor force participation rate is around five percentage points higher than that of the nation as a whole, as shown on the chart below. The participation rate is calculated by diving the labor force by the whole population. Thus about 72% of Wisconsinites are in the labor force.
Labor force participation rate
The next graph shows the national and Wisconsin unemployment rate since the start of the 21st Century. The rate is calculated by the ratio of the number of people who are actively looking for a job divided by the number of people in the work force. Wisconsin’s rate closely tracks the national rate. It appears that Wisconsin employers may be more reluctant to lay off employees than are those nationally.
By historical standards, the unemployment rate is unusually low.

Unemployment rate
The graph below shows the number of non-farm jobs both in the US and Wisconsin. Although Wisconsin jobs closely track the number of jobs in the nation, their growth is slower. This difference can be particularly evident in the recovery from the recession due to COVID-19. Nationally the job numbers are greater than the numbers before the recession. By comparison, Wisconsin has still not completely recovered.
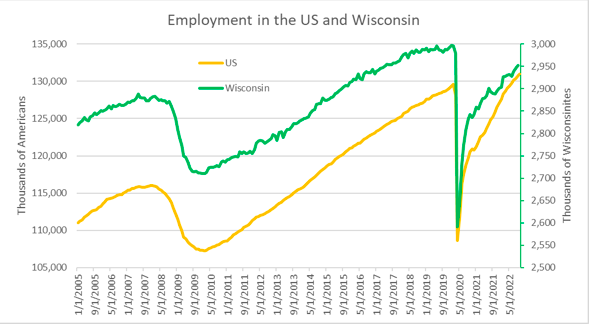
Unemployment in the US and Wisconsin
Overall, both the US and the Wisconsin economies look quite strong. The question, of course, is whether the Federal Reserve’s efforts to bring down inflation will end this run of economic growth.
If you think stories like this are important, become a member of Urban Milwaukee and help support real, independent journalism. Plus you get some cool added benefits.
Data Wonk
-
Who Do You Trust to Conduct Elections Fairly?
 Apr 6th, 2026 by Bruce Thompson
-
Is Non-Citizen Voting a Real Threat to Elections in Wisconsin?
Mar 18th, 2026 by Bruce Thompson
-
How Global Climate Change Affects Milwaukee
 Mar 11th, 2026 by Bruce Thompson