How Do City, State Rank In Gun Homicides?
Guns in household less of a factor than a state’s legal restrictions.

Hanging sculpture of guns from another angle. Photo by Craig Mastantuono.
Last week’s column on gun deaths generated a number of thoughtful comments and questions. In this column I hope to respond to several.
Homicides and suicides are the two major sources of deaths from firearms. Nationwide, according to data from the Centers for Disease Control and Prevention (CDC) there were 8.3 homicides per 100,000, compared to 13.6 suicides using a firearm. Far more people die from suicide than from homicide.
Not surprisingly, the number of suicides in a state is strongly related to the number of households with guns. For example, the graph below compares statewide suicide rates to each state’s household with firearms ownership rate (hfr). The suicide rate is based on CDC data. The firearm data comes from a Rand study.Slightly more than half of the variation among state suicide rates can be attributed to variation in the number of guns in an average household. This follows common sense. If a gun is available, it is a natural candidate for someone considering suicide — whether or not that person is the gun owner.
As so often happens, Wisconsin (shown with the circle) falls near the middle of the data, but with a death rate slightly below what would be expected from its household gun rate.
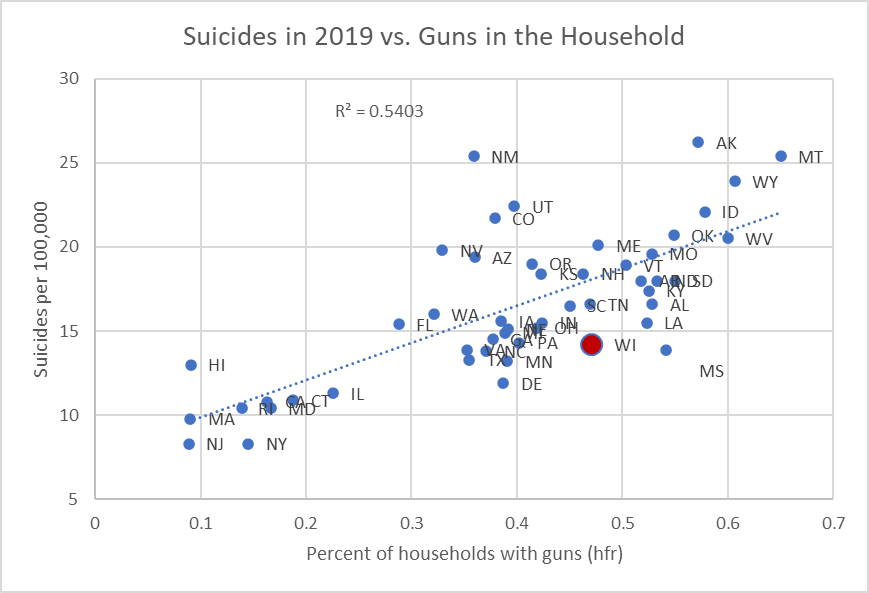
Suicides in 2019 vs. Guns in the Household
Despite the surge of gun homicides over the past two years, COVID-19 has killed substantially more Milwaukeeans during that period. According to the Milwaukee Health Department, as of March 2 of this year, 1,084 residents of Milwaukee had died from COVID-19—roughly a two year period. By contrast, there was a total of 383 gun homicides in 2020 and 2021.
For many years, research into the causes and potential of gun homicides was substantially inhibited by the so-called Dickey amendment, in which Congress prohibited the government from sponsoring research that could lead to restrictions on guns. The prohibition only ended in March 2018 when a report accompanying an omnibus spending bill said the Dickey amendment did not prohibit federal funding of research on the causes of gun violence.
How does Milwaukee’s homicide rate rank among American cities? The graph below is based on the FBI crime report for 2019, the most recent one available. In that year, which precedes the most recent spike, Milwaukee came in 13th among major cities.
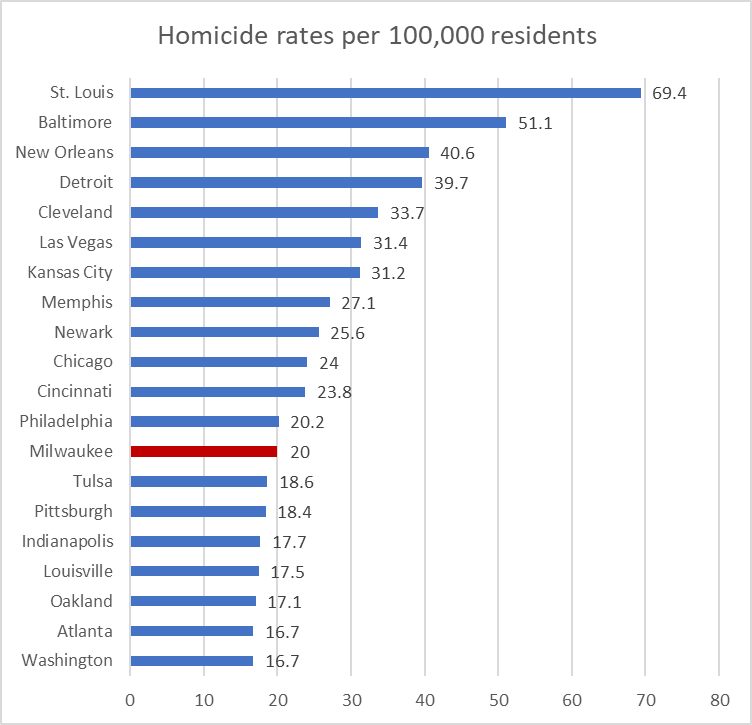
Homicide rates per 100,000 residents
In contrast to suicides, the availability of guns in households is not a major factor in the differences among state homicide rates. Although there is a positive relationship, its magnitude is small. Instead, there seem to be a number of factors that influence homicide rates.
For instance, the legal environment can substantially affect the rate of homicides in a state. Several organizations rate states according to legal restrictions on guns. For instance, the next graph compares states’ gun violence rate, on the vertical scale, to their set of gun related laws as rated by the organization Everytown for Gun Safety, on the horizontal axis.
Statistically, the relationship is very strong, as illustrated by a p-value of much less than 1%. The coefficient of determination (R2) of 47% indicates that the variation in legal policy accounts for almost half of the variation in the firearm murder rate.That still leaves room for considerable variation among cities and states. Some states, despite having a highly rated legal environment, nevertheless suffer from high homicide rates. A prime example is Maryland: despite a highly rated set of laws, it is home to Baltimore which has suffered for years with a high homicide rate.
Once again, Wisconsin falls in the middle, with a homicide rate a bit better than what its legal regime would lead one to expect. Notably, without Governor Tony Evers’ vetoes, Wisconsin’s gun laws would be even less restrictive.

Gun violence vs. gun law strength
While changing the legal environment can happen only at the state level, it is striking how localized gun culture is in practice. The next graph shows the number of shootings in each of Milwaukee’s fifteen aldermanic districts, as reported by the Milwaukee Homicide Commission’s Dashboard. The first number is the district number, followed by the number of shootings in the district during 2021.
The population of each district is about the same. Yet the number of shootings varies widely from district to district. Consider a car driving on Locust St. from Lake Michigan to the western city limits. It start in a district with 11 shootings (still too many!). After crossing the Milwaukee River, it enters a district with 140 shootings. It then passes between two districts, one with 179 shootings and the other with 205 before leaving through a district with 39.
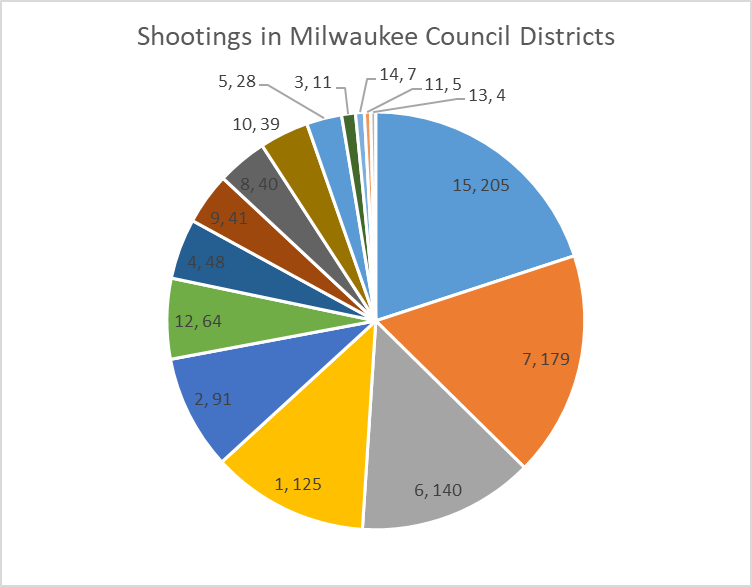
Shootings in Milwaukee Council Districts
So long as people believe that guns bring safety—and so long as Wisconsin’s legislators don’t care about the safety of people in Wisconsin’s cities—it seems unlikely that situation will change. Most disturbing is if the gun violence in some urban neighborhoods turn out to be self-perpetuating, as traumatized children grow up to themselves become agents of violence.
Data Wonk
-
Who Do You Trust to Conduct Elections Fairly?
 Apr 6th, 2026 by Bruce Thompson
-
Is Non-Citizen Voting a Real Threat to Elections in Wisconsin?
Mar 18th, 2026 by Bruce Thompson
-
How Global Climate Change Affects Milwaukee
 Mar 11th, 2026 by Bruce Thompson