How We’ve Recovered From Economic Woes
Recent history shows similar patterns -- and keys to recovery -- for Wisconsin and U.S.

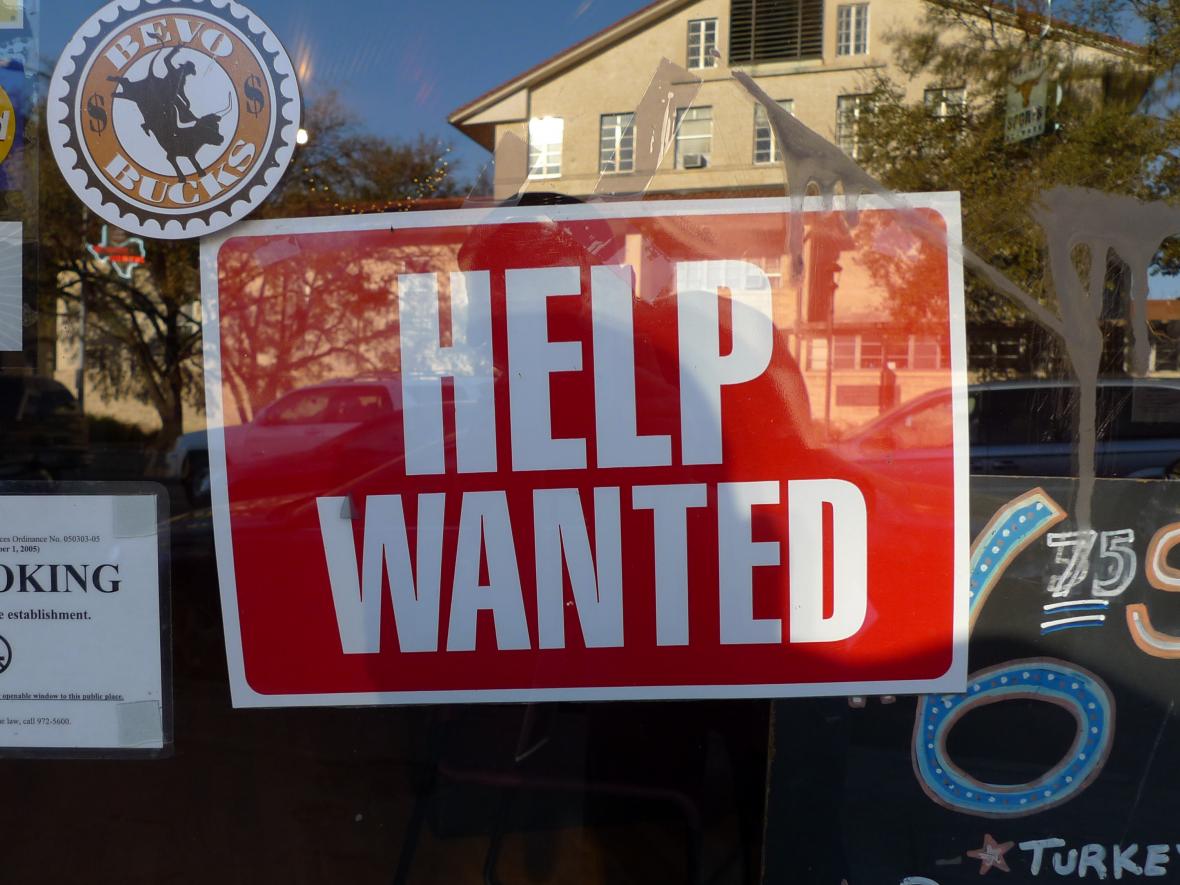
Help Wanted. Photo by Andreas Klinke Johannsen (CC BY-SA 2.0)
A history of the American economy over the past 50 years presents some answers – and mysteries – as to how we’ve recovered from recessions.
The graph below shows the civilian unemployment rate since 1976 both nationally (in black) and in Wisconsin (in green). It also shows the recessions that hit the United States during that period: Typically, unemployment peaks at the end—or after the end–of the recession. The graph includes:
- A pair of recessions in rapid succession, the first running from February to July of 1980, followed by a second from August 1981 to November of 1982 (shown by the first two yellow bars in the chart below). The main cause was the Federal Reserve’s effort to squeeze out rising prices.
- A contraction running from August 1990 to March of 1991 that contributed to Bill Clinton’s defeat of George H.W. Bush.
- A mild recession running from April to November of 2001, marking the end of the dot-com boom.
- The Great Recession between January 2008 and June 2009.
- The most recent recession in March and April of 2020, resulting from COVID-19 restrictions.
For much of this period, but not all, Wisconsin’s unemployment rate was lower than the national average, a pattern that seems to have returned most recently.
Also, the length of recessions has varied widely, from a low of two months most recently versus 18 in the Great Recession.
The next graph plots the percentage increase of jobs during those recessions’ recovery periods. The horizontal axis shows the number of months since the economy hit bottom. The vertical axis shows the percentage of jobs gained from the end of the previous recession.
Note that the job gain following the Great Recession was substantially lower than during the two previous major recoveries. The evidence points to the hypothesis that the Obama administration underestimated the size of the need. Thus, while the stimulus offered by the American Recovery and Reinvestment Act (ARRA), was able to end the economic decline, it was too small to stimulate rapid growth.
By the time the administration realized that more was needed, it was too late to launch a second plan. Democrats had lost control of Congress and the Tea Party movement strongly opposed government programs.
One notable aspect of this graph is how much the pre-Covid Trump economy looks like a continuation of the Obama recovery. Note the black line above showing a steady, month-by-month increase in jobs since the post-2008 Great Recession, continuing through two notable events: Donald Trump’s inauguration (month 84) and passage of Trump’s Tax Cuts Act (month 96). Neither is associated with a change in the rate of adding jobs. (The gross domestic product tells a similar tale.)
Second, the current recovery (the purple line in above graph) is anything but a straight line. Unlink the previous recovery, which seemed immune to political changes, such as the Tax Cuts Act and the change in administrations, there is a notable kink in the current recovery. This kink corresponds in time to the November 2020 presidential election and then President Trump’s attempt to reverse the outcome. Whether there is a causal relation or mere coincidence is uncertain.
As already mentioned, the pandemic recession was very much shorter than the Great Recession.
The next graph shows the number of jobs since the start of the Great Recession for the United States (black line) and for Wisconsin (green line). To a large extent, Wisconsin’s economy is a mirror image of the nation’s.
The next chart shows the change in US nonfarm jobs by month since January 2020, shortly before the pandemic hit. Other than during the two-month recession, only one month showed a decrease in jobs. This occurred in December 2020, as Trump fought to reverse the election.
The US labor force is most commonly defined as the sum of the number of people who have jobs—the yellow bars in the chart below—and the number of people looking for jobs—the green bars. The first part of the series behaves very much as expected in a recession: the number of people with jobs decreases and those looking increases. In addition, the total labor force declines, as some of those losing their jobs decide to wait, either because they take the opportunity to reassess, or because they believe there are no jobs in their field.
The later part of the series, beginning in April 2020, after the pandemic hits, is more unusual. The number of employed people increases and the number looking decreases, but the workforce itself barely budges, at a size well below that before the recession. Why has the workforce shrunk?
A number of explanations have been advanced for this mystery. Clearly the cause is not a shortage of jobs. Recruiting signs are everywhere.
One possibility is that a significant number of people don’t want to return to their miserable jobs. A related explanation is that members of the Baby Boom decided to accelerate their retirement.
The next graph shows similar data for Wisconsin. For once, the state diverges from the nation, with a current labor force a bit bigger than that before the pandemic. Again, the reasons are unclear.
(There are also two other apparent anomalies in the Wisconsin data. The first is the September 2020 peak, a peak not echoed in the national data. I think this most likely reflects sampling variation. Alternatively, perhaps this reflects an actual phenomenon, such as Census hiring when the Census was far behind its schedule. The November 2021 apparent disappearance of unemployment data is due to the Bureau of Labor Statistics not yet releasing that data at the time this column was written.)
From the viewpoint of the economy, the nation fared much better under the pandemic recession than in previous recessions. A large part of the explanation, I believe, is that there was a bipartisan consensus during the first year of the pandemic that very large programs were needed to head off job loss and poverty resulting from measures to control the virus.
This consensus led to the passage in March 2020 of the Coronavirus Aid, Relief, and Economic Security Act (CARES Act). This was the largest economic stimulus package in U.S. history,
Needless to say, the Republican embrace of spending to combat the pandemic and a possible recession did not survive the election of Joe Biden. The American Rescue Plan Act of 2021 proposed by President Biden, passed in March 2021 on a largely party-line vote.
From an economic viewpoint, the US—and Wisconsin—survived the Covid-generated recession remarkedly well. Much better, in fact, than the nation and this state have done against Covid itself. The inability of the Democrats to coalesce around a Build Back Better model, and the Republican refusal to participate in developing solutions to the nation’s challenges, suggest that the future may be considerably darker.
Data Wonk
-
Why Absentee Ballot Drop Boxes Are Now Legal
 Jul 17th, 2024 by Bruce Thompson
-
The Imperial Legislature Is Shot Down
 Jul 10th, 2024 by Bruce Thompson
-
Counting the Lies By Trump
 Jul 3rd, 2024 by Bruce Thompson


