Comparing GOP And People’s Maps
Under GOP redistricting, Republicans can win majority of Assembly with 44% of the vote.
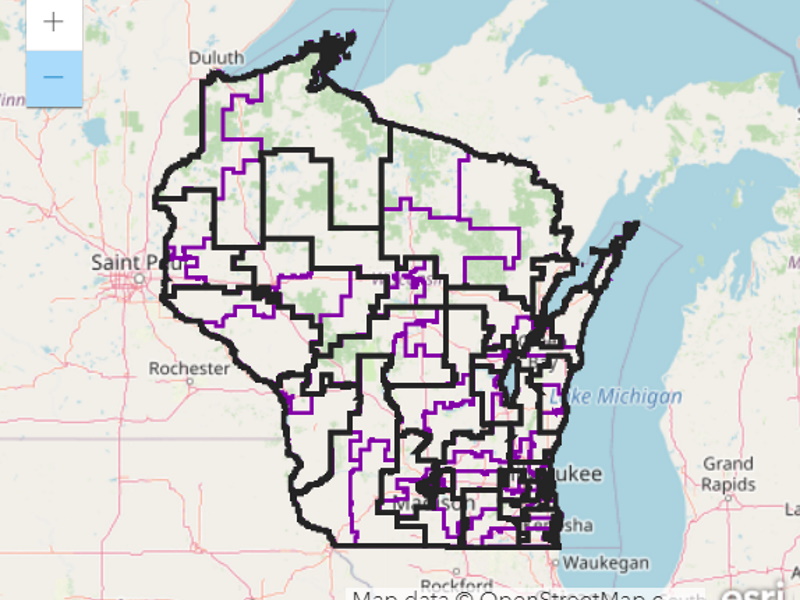
Assembly Bill 624/Senate Bill 621
With the release of 2020 census data, districts in state legislatures, as well as those for the United State House of Representatives, are required to be redrawn to reflect population changes.
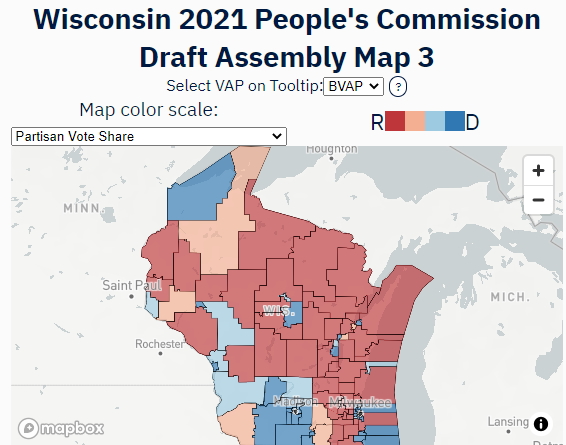
Wisconsin 2021 People’s Commission Draft Assembly Map 3
Although a multitude of maps have been proposed for Wisconsin, this column concentrates on two groups. The first group are maps passed by Republican legislators and awaiting the governor’s veto. Senate Bill 621 (identical to Assembly Bill 624) would revise Wisconsin Assembly and Senate districts. SB622 (AB625) would revise districts for Wisconsin’s congressional districts. Basically, these bills would revise yet maintain the gerrymander following the 2010 census with a clear goal of continuing Republican dominance.
The second group of maps are the three final proposals from the People’s Map Commission (PMC), the non-partisan body established by Governor Tony Evers, modeled on similar commissions in other states aimed at taking redistricting out of politics. While far more fair than SB621 and SB622, they still leave Democrats with a built-in disadvantage, pointing to the need of Democrats to broaden their base.
One measure of gerrymandering is the so-called efficiency gap. It derives from the observation that there are two kinds of wasted votes in elections: votes for candidates who fail to be elected and votes for winning candidates that exceed the number needed for victory. Gerrymandering is aimed at making the other party have most of the wasted votes.
It does this by shifting district lines so that voters for the other party move into districts that already have more than are needed to win (called “packing”). This allows it to move its own voters into other districts, shifting the majority in these districts to create an advantage for your party (called “cracking”).
Assembly District Maps
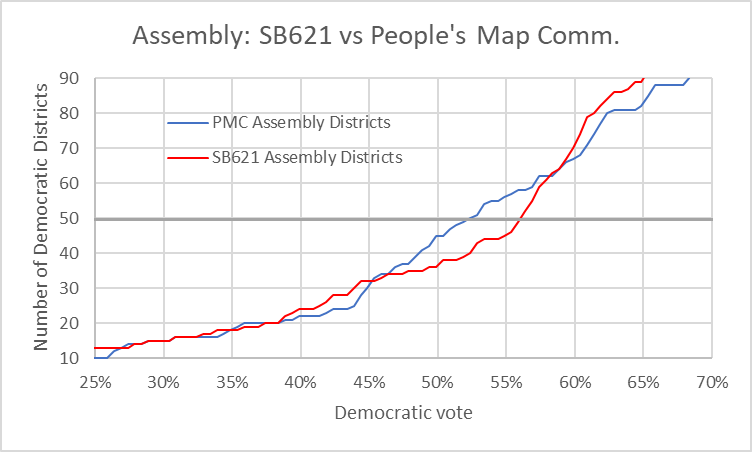
The graph below shows the results of a simulation aimed at estimating how many representatives each party would have at various levels of overall statewide support. It was developed by starting with estimates of each party’s current district, based on the last few statewide elections, as reported by the website Dave’s Redistricting.
In the simulation, votes were added to one party’s candidates and an equal number of votes taken away from the candidate of the other party. For each level of voting, the number of districts won by each party enjoyed was calculated.The horizontal axis shows the Democratic portion of the two-party vote. The vertical shows the number of districts won by Democrats. The horizontal gray line is set at 49.5, half the number of representatives. Anything above this line results in a Democratic majority; below the line, Republicans enjoy a majority.
The red line in the graph shows the number of districts likely to be won by Democrats if SB621 were enacted. Under this Republican-drawn map, Democrats would need at least 56% of the vote, to win the majority of the Assembly. The GOP, by contrast, would need to win only about 44% to control the Assembly.
The blue line represents the estimated number of districts won under the PMC’s proposal. The crossing point still requires a Democratic super-majority, but much lower, at around 52%, than under SB621.
Assembly: SB621 vs People’s Map Comm.
The next graph compares the two maps between 45% and 60%. Basically, SB621 would continue the gerrymander established following the 2010 census.
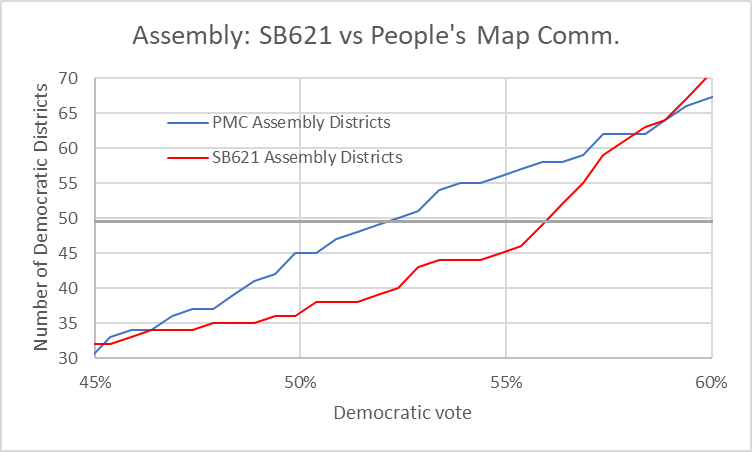
Assembly: SB621 vs People’s Map Comm.
The next graph shows the efficiency gap of the two Assembly maps. While there is still an efficiency gap for Democrats with the PMC map, it is half that of SB621.
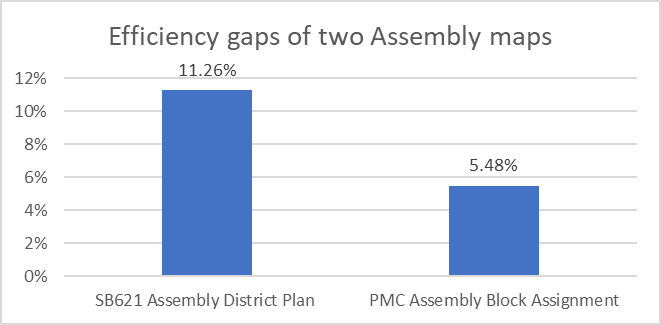
Efficiency gaps of two Assembly maps
The Dave’s Redistricting website rates proposed legislative using five measures:
- How proportional seats won are to the vote
- The percentage of districts that are competitive
- Minority representation
- Compactness and
- Splitting of counties over multiple districts and districts over multiple counties.
The graph below compares the two maps over these measures. Using a scale of 0 to 100, where 100 is best, the PMC map outperforms SB621 on every measure.
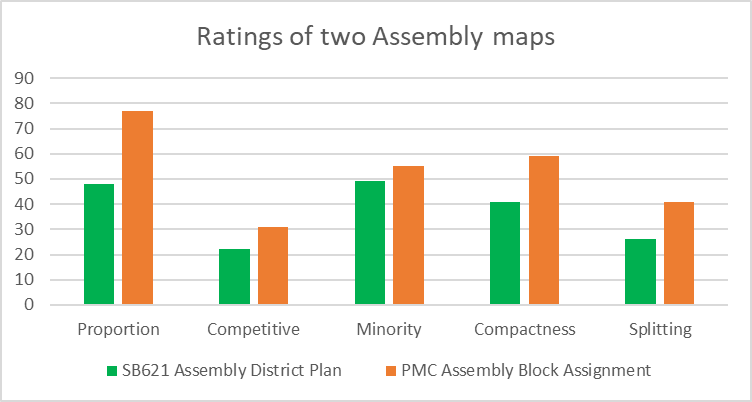
Ratings of two Assembly maps
Senate District Maps
The graph below compares the two maps for new senate districts. The gray line is set at 16.5, half the number of state senators. Once again, the proposal from the PMC comes much closer to proportionality.
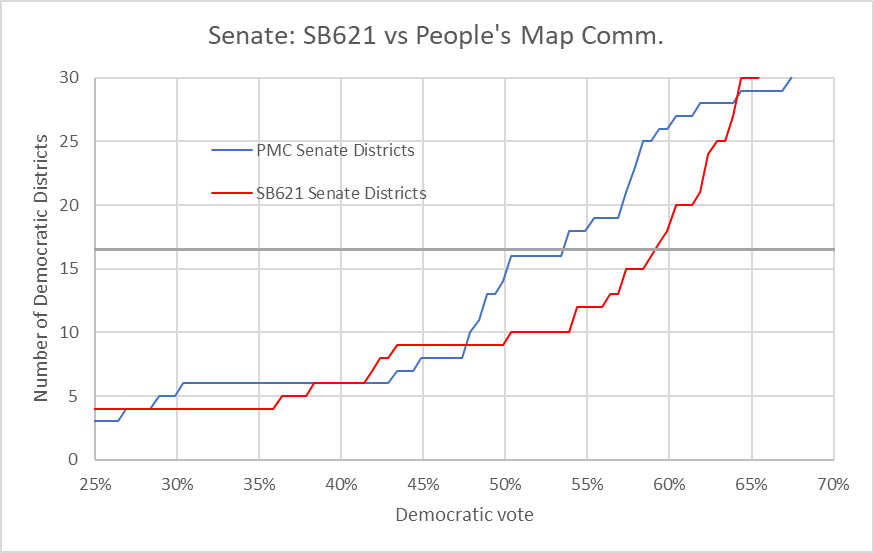
Senate: SB621 vs People’s Map Comm.
The next graph blows up the range between 45% to 65%.
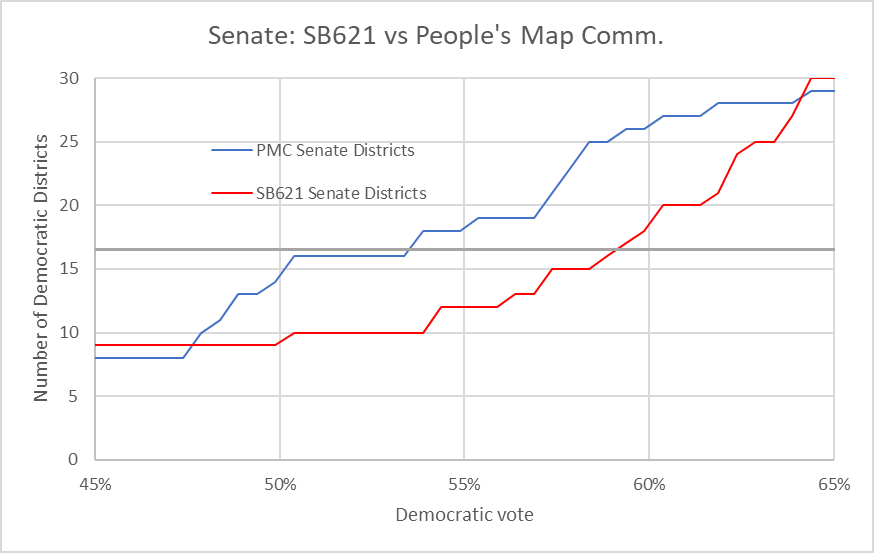
Senate: SB621 vs People’s Map Comm.
While the PMC plan, as shown below, has a much bigger efficiency gap for Democrats, it appears from the previous graph that with the right candidates, Democrats could gain control of the senate.
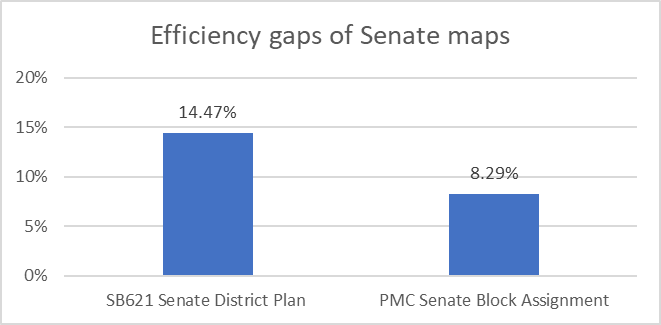
Efficiency gaps of Senate maps
Here are the ratings by Dave’s Redistricting for the two Senate maps. With one exception, minority representation, the PMC maps outperform SB621.
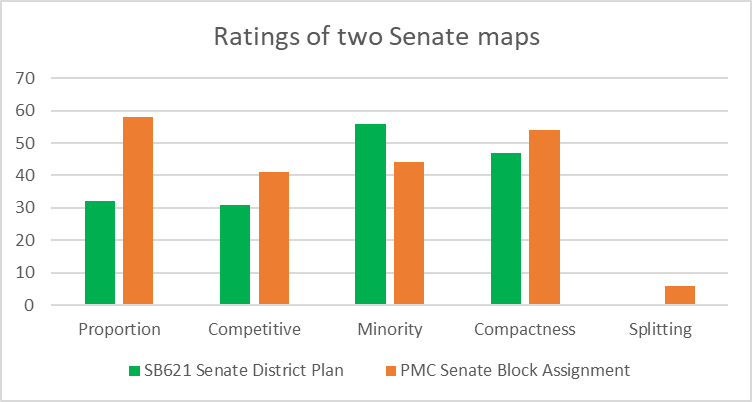
Ratings of two Senate maps
Rather than support the PMC plan, Senate Democrats came up with their own maps, which were quickly shot down. This led to considerable ribbing by Republicans. For example, Senator Duey Stroebel issued the following statement:
The fact that Senate Democrats didn’t propose the PMC maps and proposed their own, legislator-drawn maps should speak volumes. Drawing district maps is a constitutionally obligated, core legislative function. I’m glad we have a bipartisan consensus on this in actions if not in words.
Piling on, Devin LeMahieu falsely claimed:
In fact, the People’s Maps Commission, which we resoundingly rejected with a supermajority here today, in bipartisan fashion, failed to beat the legislator’s maps on every metric.
By refusing to support the PMC maps, the Senate Democrats played into the Republicans hands by helping make the argument that the fight was a partisan squabble, rather than one about the right of voters to have their voices heard.
Congressional District Maps
The congressional map proposed by SB622 and that by the People’s Map Commission share remarkable similarities. Under both, four of Wisconsin’s eight congressional districts (districts 5 through 8) would be solidly Republican. Two, centered on Madison and Milwaukee (2 and 4), would be solidly Democratic. The two remaining districts (1 and 3) would be competitive.
This is shown in the graph below. The bars show the past Democratic share of the two-party vote in past elections. The predicted Democratic vote under SB622 is shown in green, that under the PMC map is shown in rust.The major difference between the two maps involves the two competitive districts. In SB622, they have a small Republican edge in the legislators’ map. The PMC maps take enough away from district 2 and 4 to give districts 1 and 3 a Democratic tilt. Particularly with the SB622 maps, Wisconsin’s congressional delegation could consist of six Republicans and only two Democrats, even though Wisconsin has a closely divided electorate. (A recent article by the Milwaukee Journal Sentinel’s Craig Gilbert discusses this eventuality in far more depth.)
What would it take for the state congressional delegation to look much more like Wisconsin? The purple bars show the proposed redistricting by the Square Foundation, resulting in 3 solidly Republican districts and 3 solidly Democratic. The other two would be competitive. As the chart below shows, getting there would require a rethinking of Wisconsin’s congressional delegation. It would also require a return to the days when Milwaukee County was split between two congressional districts.
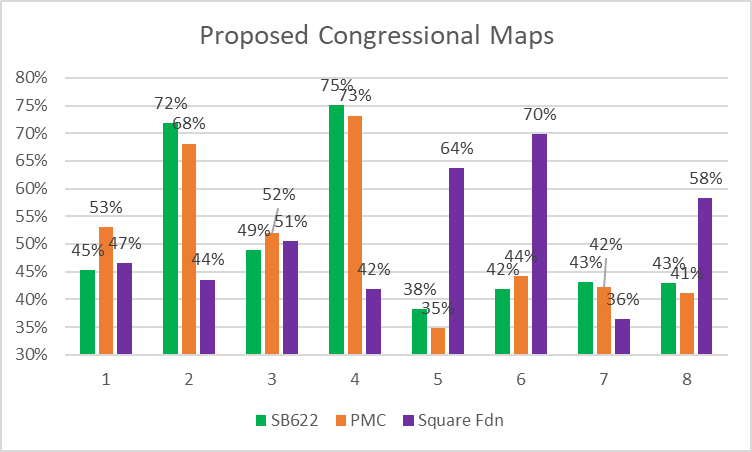
Proposed Congressional Maps
The next graph shows the efficiency gaps for the three congressional proposals described. Of the three, SB622 is atrociously evil. But even with the Square Foundation map, Democrats face an uphill battle.
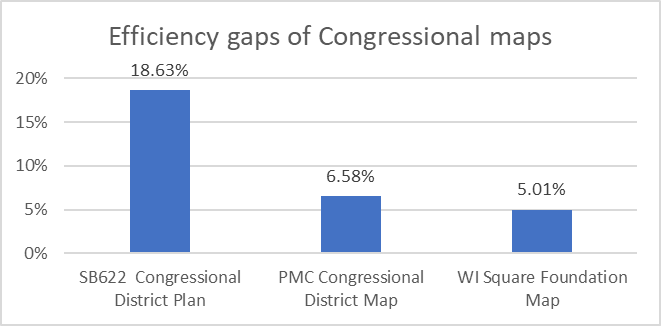
Efficiency gaps of Congressional maps
This points out one message of the present gerrymandering fight. While the less gerrymandered maps are good for democracy, Democrats will still face a battle especially if they don’t turn around the loss of support from rural and small-town voters and voters without a college degree. I would argue that Democratic policy proposals are much better for those voters and their neighbors, but that message is not resonating.
Following Governor Evers’ veto of SB621 and SB622, redistricting will go to judges, either the Wisconsin Supreme Court or a panel of federal judges. The eagerness of Republican legislators and organizations, such as the Wisconsin Institute for Law & Liberty, to have it go to the Wisconsin high court betrays a belief that a majority of its justices are partisans who will choose maps that lock in the Republican advantage.
I think it is time to reconsider the “communities of interest” requirement in drawing maps, for two reasons. First it can be used as a rationale for packing. Second, at a time when politicians are exploiting increasing partisanship, mixing voters into districts with varying views could help reduce this divisions in Wisconsin and the nation.
More about the Gerrymandering of Legislative Districts
- Without Gerrymander, Democrats Flip 14 Legislative Seats - Jack Kelly, Hallie Claflin and Matthew DeFour - Nov 8th, 2024
- Op Ed: Democrats Optimistic About New Voting Maps - Ruth Conniff - Feb 27th, 2024
- The State of Politics: Parties Seek New Candidates in New Districts - Steven Walters - Feb 26th, 2024
- Rep. Myers Issues Statement Regarding Fair Legislative Maps - State Rep. LaKeshia Myers - Feb 19th, 2024
- Statement on Legislative Maps Being Signed into Law - Wisconsin Assembly Speaker Robin Vos - Feb 19th, 2024
- Pocan Reacts to Newly Signed Wisconsin Legislative Maps - U.S. Rep. Mark Pocan - Feb 19th, 2024
- Evers Signs Legislative Maps Into Law, Ending Court Fight - Rich Kremer - Feb 19th, 2024
- Senator Hesselbein Statement: After More than a Decade of Political Gerrymanders, Fair Maps are Signed into Law in Wisconsin - State Senate Democratic Leader Dianne Hesselbein - Feb 19th, 2024
- Wisconsin Democrats on Enactment of New Legislative Maps - Democratic Party of Wisconsin - Feb 19th, 2024
- Governor Evers Signs New Legislative Maps to Replace Unconstitutional GOP Maps - A Better Wisconsin Together - Feb 19th, 2024
Read more about Gerrymandering of Legislative Districts here
Data Wonk
-
Who Do You Trust to Conduct Elections Fairly?
 Apr 6th, 2026 by Bruce Thompson
-
Is Non-Citizen Voting a Real Threat to Elections in Wisconsin?
Mar 18th, 2026 by Bruce Thompson
-
How Global Climate Change Affects Milwaukee
 Mar 11th, 2026 by Bruce Thompson