
Which Party Is Better For The Economy?
Economic data from the last 70 years suggest one party does a better job of managing the economy.

100 Dollar Bill. Photo by Dave Reid.
Periodically, the press, as well as academic economists, have analyzed how the American economy has fared under presidents from each major political party and come to a counter-intuitive conclusion: over much of the past century the economy has performed better under Democratic presidents than under Republicans. But, aren’t Republicans supposed to be the party of business?
To see whether this pattern has continued in recent years and, if so, explore possible explanations, this column uses data posted at the Federal Reserve Bank of St. Louis’ FRED website. The data originated from various federal agencies.The first measure used is growth in gross domestic product (GDP) during each president’s term. The underlying data was developed by the U.S. Bureau of Economic Analysis. This data series starts in 1947 with Harry Truman’s reelection and continues through the first six months of Joe Biden’s presidency. To compensate for the variation in the number of years the presidents served, the actual change in GPD was converted to a yearly basis.
The bar graph below summarizes the results. The bars show the average annual GDP growth during president’s term in office. Growth under Democratic presidents is shown in blue; that under Republicans in red. A glance at the graph shows that growth under Democrats mostly exceeded that under Republicans.
The average growth for each president confirms that observation. For Democrats it was 3.9% compared to 2.3% for Republicans. Thus, the average partisan difference was 1.6%.
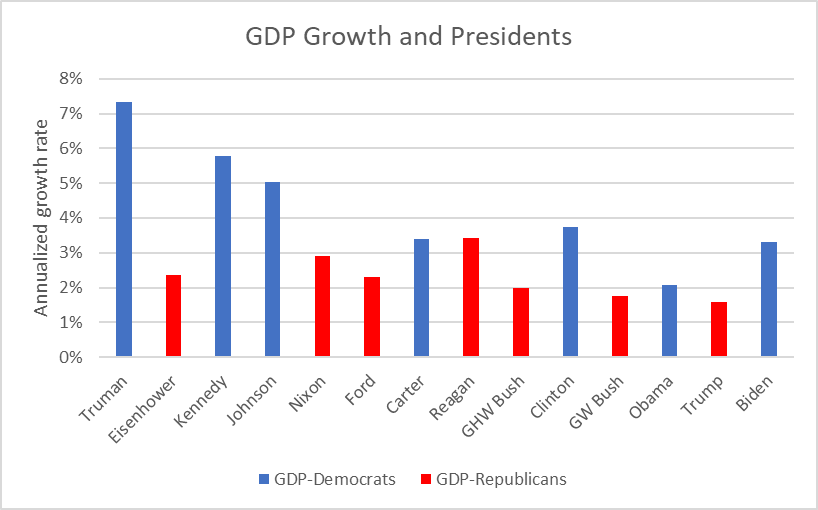
GDP Growth and Presidents
The next measure used is average annual job growth during each president’s term, using data from the U.S. Bureau of Labor Statistics. Again, job growth during Democratic administrations exceeded those during Republican presidencies, as shown in the graph graph. Average job growth for Democrats was 2.82%; for Republicans it was 0.95%. The result is a partisan gap of 1.87%.
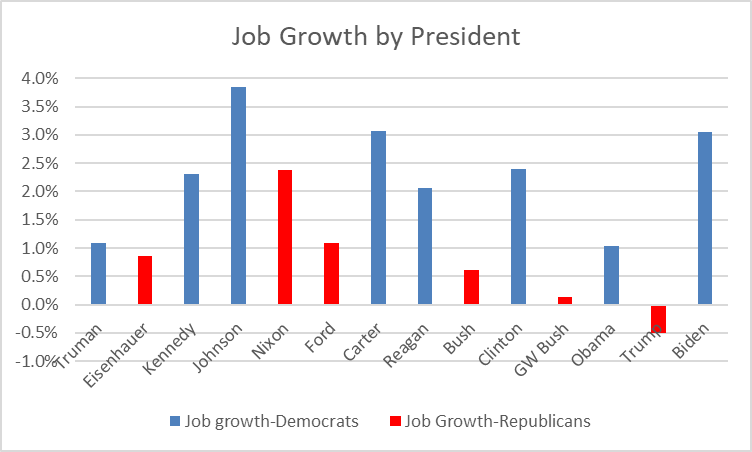
Job Growth by President
The next chart shows the change in the unemployment rate between taking office and leaving it. Strikingly, every Democratic president saw a decline in unemployment, averaging -1.6%. By contrast, unemployment rose by an average 1.9% for every Republican president since Dwight Eisenhower, resulting in a partisan gap of 3.5%.
Notably, all seven Democratic presidents saw a decline in unemployment and six of the seven Republicans saw an increase. What is the likelihood of this happening by chance? If rising or falling unemployment resulted from some random process, the probability of receiving seven terms of falling unemployment and no terms of rising unemployment would be well less than one percent.
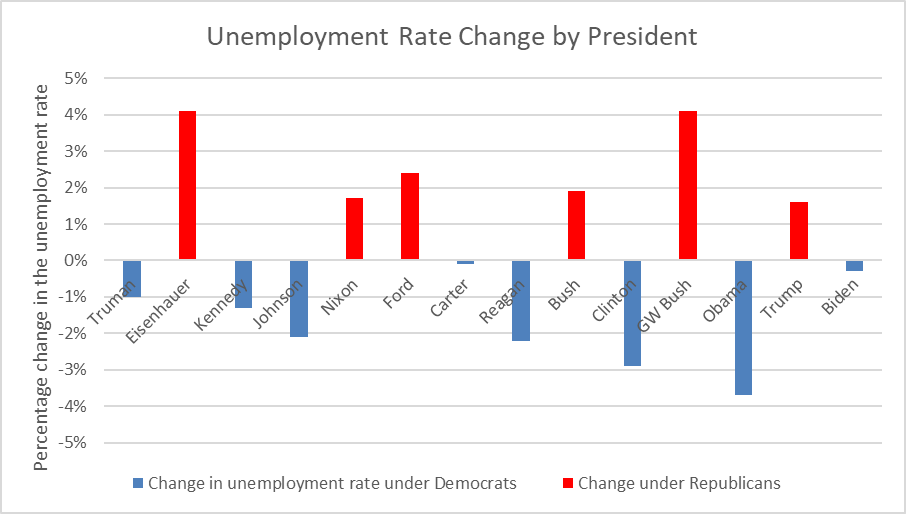
Unemployment Rate Change by President
The next graph shows the change in the Standard and Poor’s 500 stock price index. The average increase for Democrats was 5.90%; for Republicans, it was 3.11%, for a partisan gap of 2.79%.
Between January and October of this year the S&P index grew by 15%, which translates to an annualized rate of 21%. I did not include this on the chart because it is likely to be unsustainable.
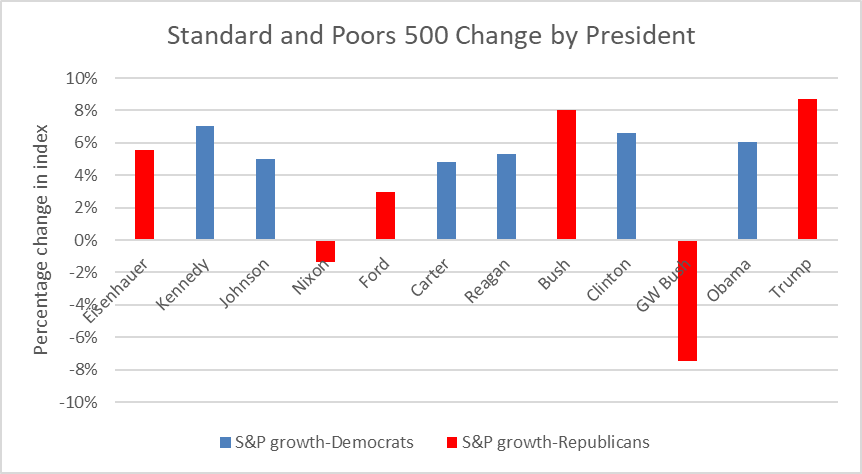
Standard and Poor’s 500 Change by President
The next chart shows the change in the Census Bureau’s estimate in the percentage of Americans in poverty. On average, during Democratic presidencies poverty dropped by 2.2% per year. During Republican presidencies it increased by 1.3% per year. The data only start in 1989. They stop at 2019, so only the first two years of the Trump administration are included.
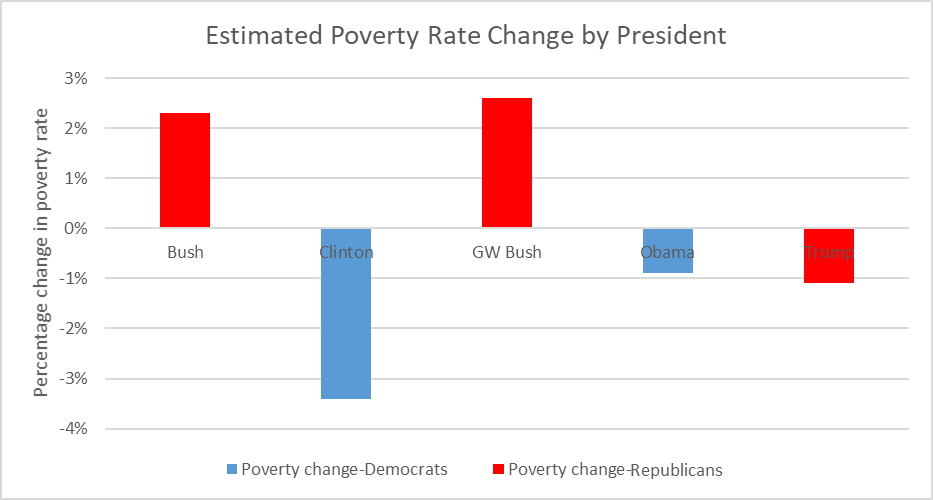
Estimated Poverty Rate Change by President
The next chart summarizes how the nation’s economy has performed during the postwar period up until this year. The evidence seems compelling that it has done better under Democratic presidents than under Republicans.
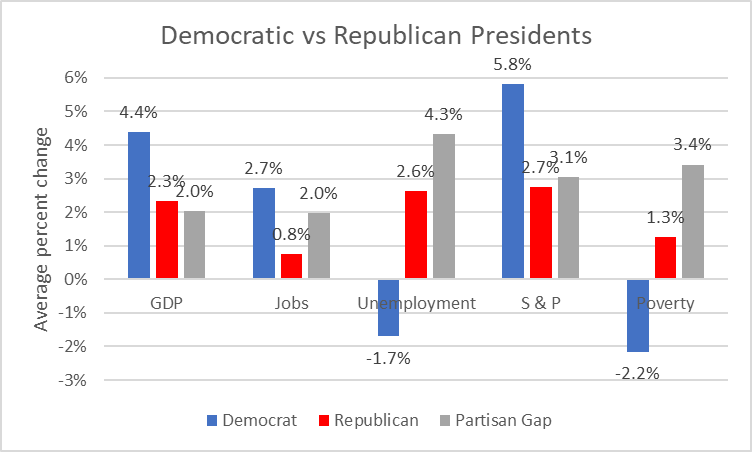
Democratic vs Republican Presidents
These conclusions are consistent with findings from economic studies. The most well-known of these was published in 2017 by two Princeton economists, Alan Blinder and Mark Watson. They concluded that “The US economy has performed better when the president of the United States is a Democrat rather than a Republican, almost regardless of how one measures performance.” Later, they expand on this point, saying “It is clear at a glance that GDP growth rises when Democrats get elected and falls when Republicans do. There are no exceptions.”
There are a number of design differences between the analysis presented here and the analysis in the Blinder paper. One is the time covered. This analysis added 8½ more years—the second Barack Obama term, Donald Trump’s, and the first 6 months of Biden’s.In addition, Blinder used full four-year terms as the basis for analysis, for example labeling the terms Clinton 1 and 2 or Nixon/Ford while I used the actual starting year for each president. Finally, they credited the first three months of the incoming president to his predecessor. Despite these design differences, their conclusions are very similar to mine. For example, the next graph compare the average growth in GDP for Democratic and Republican presidents found by them to those I found.
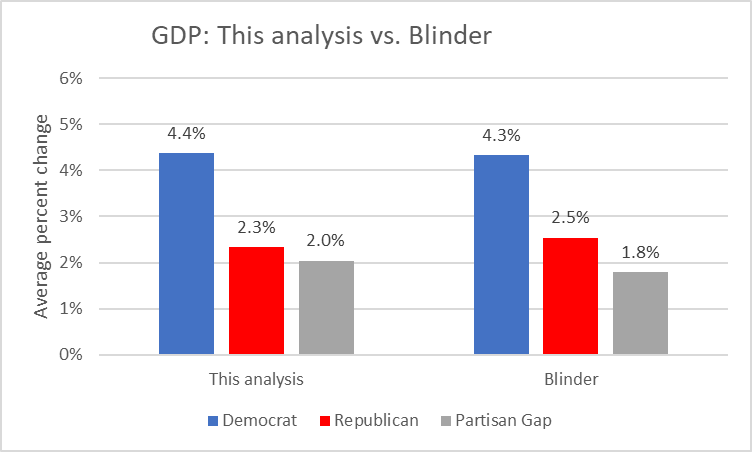
GDP: This analysis vs. Blinder
The stability of the Democratic advantage suggests that these differences reflect something real and not the result of randomness.
CORRECTION: An earlier version of this story included calculations and graphs for unemployment, jobs, and S&P that incorrectly put President Ronald Reagan in the Democrat category. The charts and calculations have been update to correct this error.
Data Wonk
-
How Global Climate Change Affects Milwaukee
 Mar 11th, 2026 by Bruce Thompson
-
Will Lawsuits Demanding New Congressional Maps Succeed?
 Mar 4th, 2026 by Bruce Thompson
-
What the 2025 Elections Data Tells Us
 Feb 11th, 2026 by Bruce Thompson


Bruce, Thanks for this analysis! I always look forward to your articles.
Just thinking – How about an analysis of the political party/economy performance with the rise and fall of violent crime, particularly shootings and murder.
Off the top, didn’t violent crime rise late in the Reagan / Bush era, then fall during the Clinton era? Same again with second Bush and then Obama? And then tick up during the Trump years? Will it begin to fall during the Biden era?
Generally, violent crime continued to rise early in the Democratic administrations, and fall early in the Republican administrations, but violent crime would be a trailing indicator to economic conditions. Maybe the keys are job growth and poverty decrease?
Very interesting! However, you may want to make a correction by noting that unemployment dropped during the Reagan administration (according to your chart). Therefore, the narrative in your article should state that unemployment increased under 6 of 7 Republican Presidents (rather than all 6). Thank you.