
Are The Rich Overtaxed?
So claim conservatives. But how much of the total tax burden are they including?
Cash. (CC0 Creative Commons).
The proposals from the Biden administration to increase taxes on wealthy people have provoked increased discussion on who pays for government programs. The House Committee on Ways and Means has proposed tax changes in its so-called budget reconciliation bill. Congress’ Joint Committee on Taxation has analyzed the proposal and estimated the distributional effects of the legislative recommendations. As a reconciliation bill, the legislation would avoid a filibuster and could be passed by a simple majority.
Their estimates of the average income tax rate by income level in 2023 are shown in the following graph. The orange bars show the average rates under current law. The green bars show rates in the proposed legislation in 2023 if the current proposal is enacted. As promised, this bill would increase taxes on wealthy people, particularly those making more than a million dollars.It would also reduce taxes on taxpayers making less than $200,000. This reduction is particularly dramatic for the lowest paid people, as shown by the downward-facing green bars on the left of the chart. Netting out the increased taxes on wealthy taxpayers against the increased child credits, it appears that these changes would cost the treasury about $12 billion.

Average Tax Rate–2023
The reduction in taxes largely results from expanding the child credit, including making it refundable, so that a low-income family could receive more in the credit than they pay in taxes. An analysis by the Tax Policy Center finds this expansion of the child credit would have a dramatic effect on child poverty, cutting it almost in half in Wisconsin, as shown on the next graph.
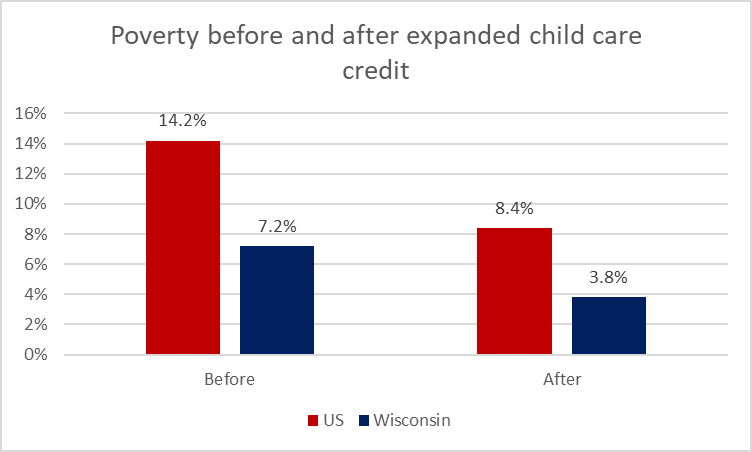
Poverty before and after expanded child care credit
Unfortunately, the rules for a reconciliation bill discourage commitments to long-term spending. Thus, by 2027, the expanded child tax credit disappears.
This eventuality was greeted with enthusiasm by some in the Republican press. Thus the reliably conservative Washington Examiner published an article under the headline “Biden tax hikes would hit middle class after expiration if expanded child tax credit expired: Congressional analysis.”
The next graph shows what happens is the child credit is allowed to lapse. Moderate-income families, on average, would see a slight increase in their tax rates, compared to present law.
The hope for supporters of the child credit, of course, is that Congress will find a way to continue the credit when faced with the possibility of its demise. Throwing millions of children back into poverty may not be a popular step.
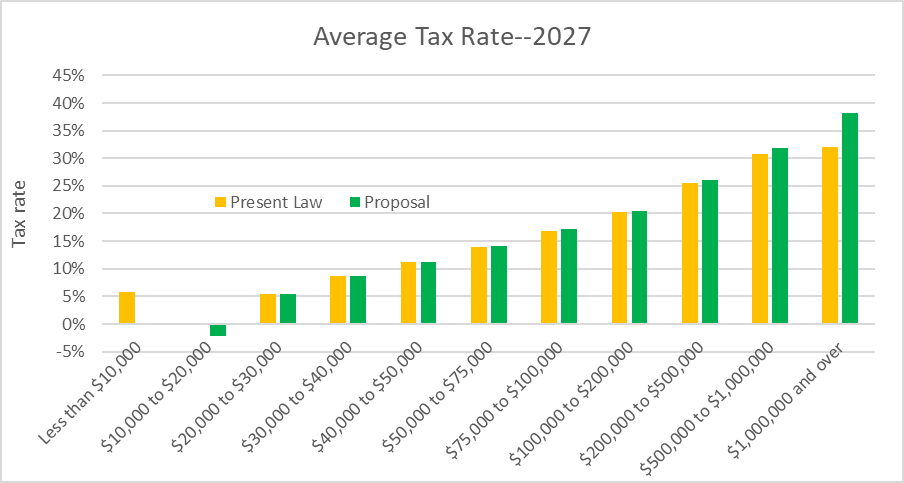
Average Tax Rate–2027
The notion that rich people are overtaxed has its supporters, especially on the right. Recently PolitiFact examined claims on Facebook that the top 1% pay 90% of federal income taxes and rated them false.
A somewhat more credible claim is that the top 1% pay 40.1% of taxes. This claim is based on analysis of the federal income tax by the conservative Tax Foundation summarized in the graph below, comparing the share of total adjusted gross income with the share of total income taxes paid by income level. This only shows the impact of the federal income tax and shows the super-rich are hardly suffering financially, receiving 20% of the nation’s income. The average member of the 1% has $1,453,106 left over after paying all taxes.
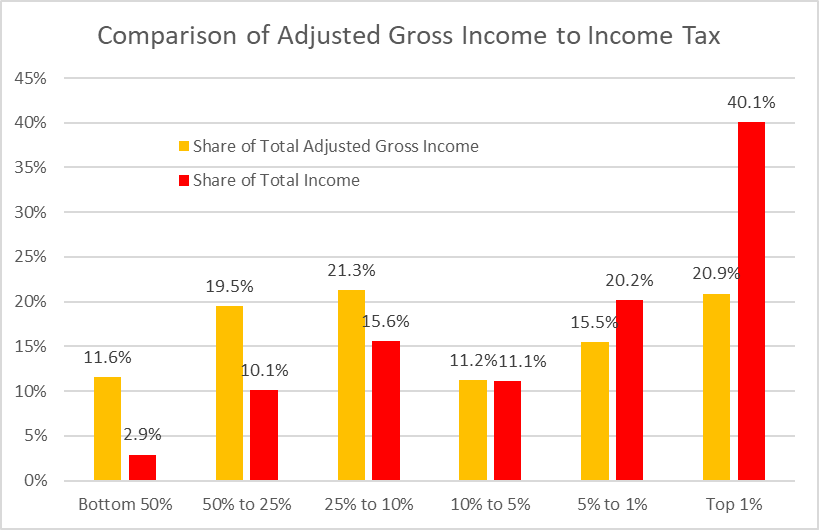
Comparison of Adjusted Gross Income to Income Tax
But this ignores the fact that the federal income tax is only one of the federal, state, and local taxes that people pay. It is by far the most progressive of these taxes. The next chart, based on data from the Institute on Taxation and Economic Development (ITEP) shows the burden of state and local taxes as the share of family income for three states: California, Wisconsin, and Washington.
The analysis looks at what share of income the low-income and middle-income taxpayers pay compared to the top 1% and finds:
- California’s system is least regressive: its total tax burden is quite flat across income levels, generally falling between 8% and 10% of income. ITEP gives California the highest score of all the states.
- Washington gets the worst rating. With no income tax, its tax burden falls heavily on low-income people.
- Wisconsin’s taxes fall in the middle. Most taxpayers pay about 10% of their incomes. The top 5%, however, pay a lower rate, which declines further for the top 1%.
No state in the nation has a tax system that could be considered progressive, in which tax rates rise as incomes rise.
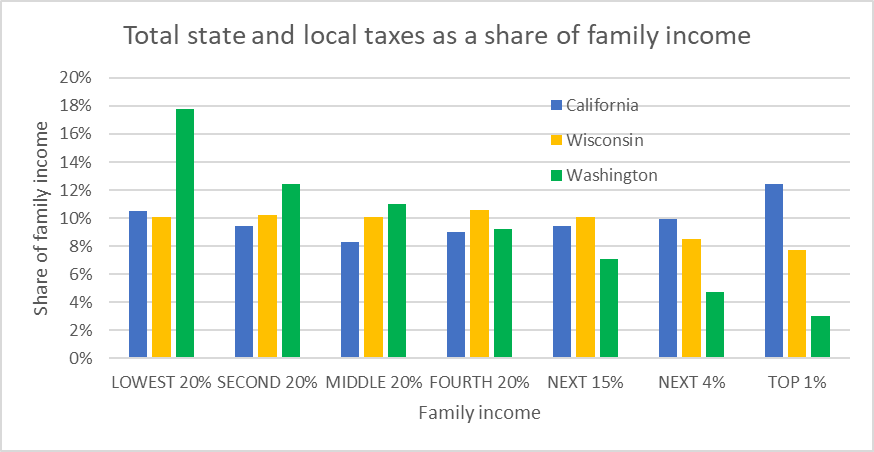
Total state and local taxes as a share of family income
The chart below shows the average percentage of total tax payments by income. Based on ITEP data, it includes federal, state, and local taxes, not just the federal income tax. The contribution of the top 1% drops to 24.1%, not very short of its share of the nation’s income.
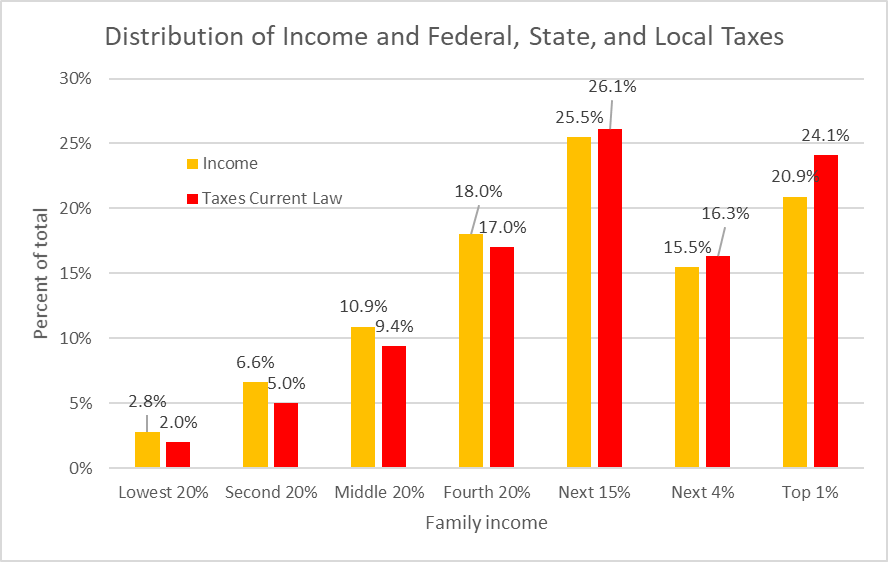
Distribution of income and federal, state, and local taxes
Conclusion: Contrary to the claims by some among the wealthy, the wealthy are not paying their fair share of the costs of government.
Data Wonk
-
Who Do You Trust to Conduct Elections Fairly?
 Apr 6th, 2026 by Bruce Thompson
-
Is Non-Citizen Voting a Real Threat to Elections in Wisconsin?
Mar 18th, 2026 by Bruce Thompson
-
How Global Climate Change Affects Milwaukee
 Mar 11th, 2026 by Bruce Thompson


Some additions to Bruce Thompson’s excellent analysis: (1) The United States is the most unequal advanced nation on earth. Our income/wealth profile (a tiny sliver of extreme wealth, a declining middle-class and entrenched poverty) is shared by only three other countries: Russia, Brazil and Mexico. Not exactly nice company. (2) The triumph of “taxes are theft” has produced our decaying physical infrastructure and other “public” systems that make us vulnerable to all kinds of dangers. (3) In the hands of extremists (think Hendricks, Menard, Bradley/WILL in Wisconsin), dark, untaxed money has put extreme wealth and corporate/Wall Street power in control of the country, bringing us close to the classic definition of plutocracy. (4) Knowing that their greed-driven “values” would be unpopular, these forces have actively shifted the focus, “hey, look over there,” to racial hatred and white victimization with devastating consequences for society, and potentially far worse to come. (5) We have been told for decades that big tax cuts for rich people and corporations would spark a big boom and pay for themselves. There has never been an accounting for the fact that this has not come to pass. (6) We are now on the edge of having a national hereditary elite, with enormous wealth be passed on from generation to generation. Think Ivanka, Eric and Don Jr. on a large scale. (6) Most important, According to the historian Walter Scheidel in his book “The Great Leveler,” no country with our levels of extreme inequality has ever escaped massive civil violence. We can’t say we weren’t warned.
Eat the rich.