Can Biden Improve the Economy?
Democratic presidents typically do better, but Biden will face an obvious challenge.
Joe Biden. Photo is in the Public Domain.
In its pre-election analysis of the consequences to the nation’s economy of the reelection of Donald Trump versus the election of Joe Biden, Moody’s Analytics compared four scenarios. At each extreme were scenarios in which either Republicans or Democrats swept the election, winning the presidency, and gaining control over both branches of Congress.
My pre-election column on the Moody’s Analytics report concentrated on the two extreme scenarios. They offered the most striking differences in economic outcomes. Under a Democratic sweep, the American economy recovered far more quickly from the present recession than it did under a sweep for Republicans.
What about the two middle scenarios, however, with split party control? Moody’s Analytics assigned only a 25% probability to the likelihood that either party would sweep the election. The other 75% went to divided government with Republicans continuing to control the Senate and Democrats the House. Unless Democrats win both Senate seats from Georgia in January, the actual election outcome will fit the “Baseline” scenario.
The next graph shows the projected unemployment rate at the end of the next four years under each of the four scenarios.

Unemployment After 4 Years
The following graph shows the projected job growth, in millions, over the next four years.
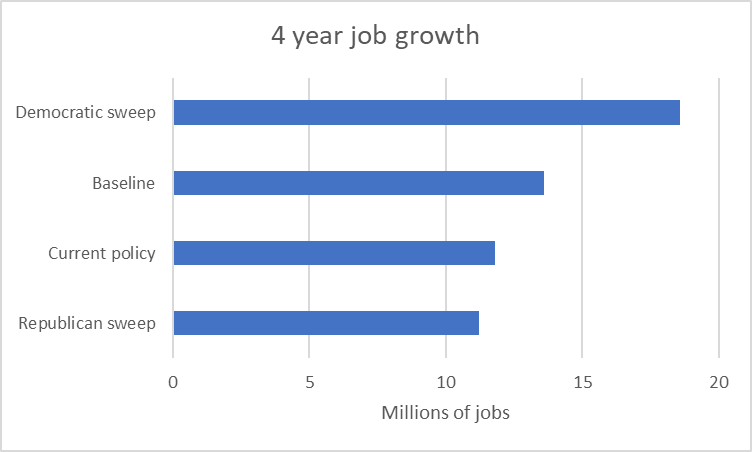
4 Year Job Growth
Finally, the next graph compares the projected gross domestic product at the end of the next presidential term.

Gross Domestic Product After 4 Years
Why does the model predict faster economic growth with the Democratic sweep scenario than with the three other scenarios? One factor is that Biden proposes a series of quite ambitious spending plans in four areas: infrastructure, education, the safety net and healthcare. Under the Democratic sweep scenario, the model assumes that he would have Congressional support for these initiatives.
Biden’s proposals would increase economic activity through several mechanisms. They would expand available jobs. Those hired, in turn, would spend their wages, creating more demand and more business activity.
Other Biden proposals also have the effect of increasing demand. For instance, he proposes a partial forgiveness of student debt. With a lesser debt burden many people are likely to increase spending on other things. His proposal to expand medical coverage would likely have a similar effect.
Biden’s proposals also expand the supply part of the economy. For example, upgraded infrastructure and education help make the United States more competitive and increases productivity. Family leave and elder care would increase labor force participation.With Republican control of the Senate, however, the model assumes that Biden would be largely limited to things he could accomplish through presidential executive order, which would have far less impact. During the campaign, Biden was widely mocked as naïve for his belief that he could find common ground with Republicans. Yet, without finding such common ground, the economy’s recovery is likely to be frustratingly slow.
The next chart shows average percentage GDP growth for each four-year presidential term since the end of World War II. For presidents who served eight years, I treated each 4-year term as independent and labeled them, for instance, Obama-1 and Obama-2. With newly arrived presidents, I treated the first quarter of the calendar year as the last quarter of the previous president based on the assumption that it took a while for the new president’s policies to be felt.
There are two striking patterns to this data. The first is that the nation’s economy seems to do better when a Democrat (shown in blue) is president than a Republican (shown in red). The second is that GDP growth seems to be slowing down. No one since the 1960s has been able to match the growth of the Truman and the Kennedy/Johnson years.

Average Annualized GDP Growth, by Term
A number of explanations have been offered for the first pattern, including just coincidence in a small-sized sample. Alternatively, perhaps people vote Republican when GDP is already high and likely to go down and Democratic when the economy seems to be sputtering.
However, I would suggest that the root cause is a greater comfort among Democrats with active government, reflected in Biden’s proposals. Government programs are seen as opportunities to improve peoples’ lives. This stands in stark contrast to President Reagan’s comment that government is the “problem, not the solution.”
The next chart turns the data in the chart above into a scatter plot. As before, the vertical scale shows the annualized percentage growth in GDP. On the horizontal scale the dots are located on the midpoint of each president’s term(s). Except for Trump, all terms are four years long. In Trump’s case, the term is 3½ years, since we don’t have data for the last quarter of 2020 or the first of 2021.
The two dotted lines are trend lines—blue for Democratic presidents and red for Republicans. Among the Democrats, GDP growth shows by far the steepest decline. Republican GDP growth starts lower and declines more slowly.
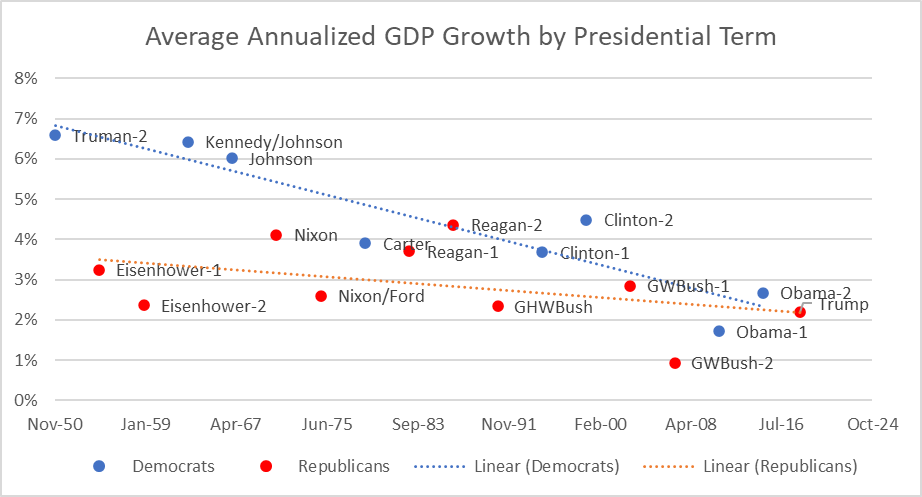
Average Annualized GDP Growth by Presidential Term
Consider the next graph which plots the jobs recovery from each of the four most recent recessions. Each is plotted by month from the bottom of the previous recession. The recovery that started in December 1982 during the Reagan administration and lasted until early in the George HW Bush administration is shown in blue. The recovery that started late in the same Bush administration and lasted through the Clinton administration is shown in red. There is a short recovery during the George W Bush administration, shown in green. Finally, the recovery, shown in black) that started with Obama and lasted through the first three Trump years, only to be killed by the coronavirus.
Look at the three long-term recoveries. Each is weaker than its predecessor: each takes longer to recover the same number of jobs. The graph also shows, with dotted vertical lines, the date Trump was inaugurated and the effective date of his Tax Cuts act. Neither event has a noticeable impact on jobs recovery despite Trump’s very different views than his predecessor on practically every subject. From the standpoint of economic outcomes, the first three years of Trump looks like a continuation of Obama.
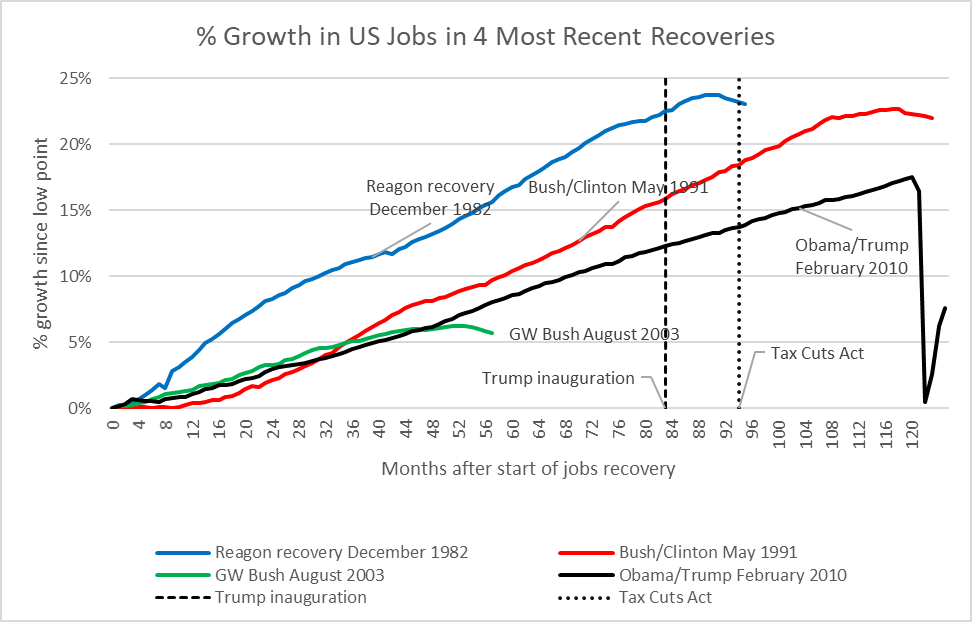
% Growth in US Jobs in 4 Most Recent Recoveries
Several theories have been advanced for this decline in the rate of growth, including the aging of the baby boomers, the end of the growth of women in the workforce, or a decline in the spirit of innovation.
After its first year, the Obama administration lost its ability to pass legislation (similar to the Biden proposals) that would stimulate the economy. Mitch McConnell, the Republican Senate leader announced that his goal was to make sure that Barack Obama was a one-term president. While he failed in that goal, McConnell succeeded in making sure no more stimulus funding was passed.
Although the Biden administration has yet to begin, the New York Time economic columnist Neil Irwin recently suggested that it might “show uncanny similarities to the 2011-to-2016 Obama economy. In short, a long slog back to health,” as the Republican Senate resists Biden’s effort to stimulate the economy.
Data Wonk
-
Who Do You Trust to Conduct Elections Fairly?
 Apr 6th, 2026 by Bruce Thompson
-
Is Non-Citizen Voting a Real Threat to Elections in Wisconsin?
Mar 18th, 2026 by Bruce Thompson
-
How Global Climate Change Affects Milwaukee
 Mar 11th, 2026 by Bruce Thompson