Could Polls Be As Wrong As In 2016?
Presidential polls of state look much like 2016. Experts say it's different this time.

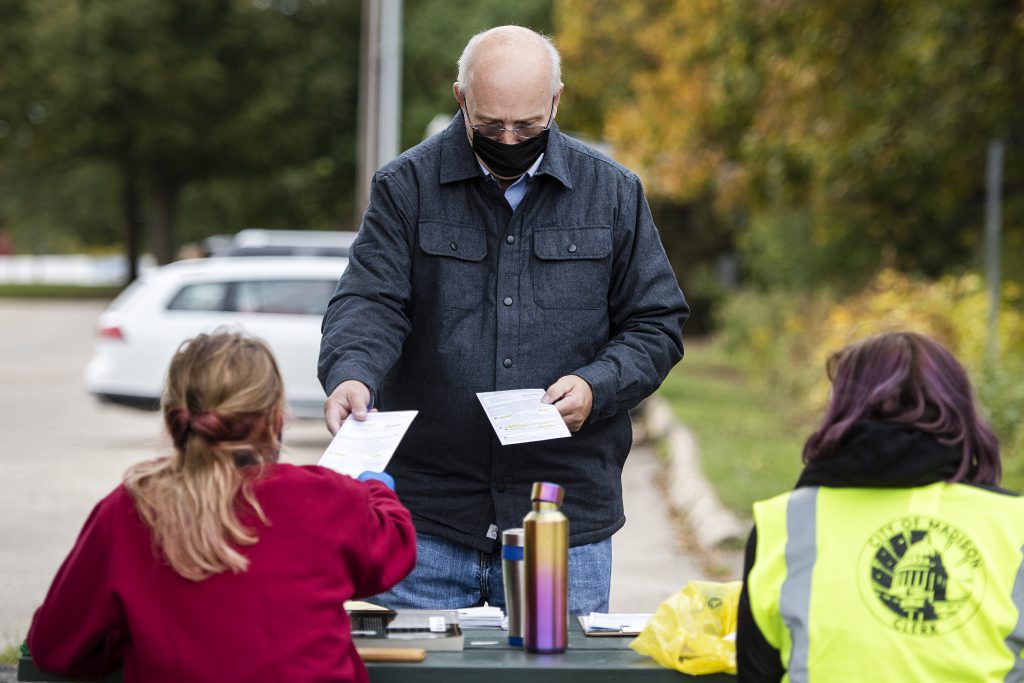
Ken Disch stops by the Democracy in the Park event Saturday, Oct. 3, 2020, at Garner Park in Madison. Angela Major/WPR
On election night in 2016, when Republican Donald Trump captured the White House, a lot of people were surprised.
For months, state and national political polls had shown Democrat Hillary Clinton winning the presidency. Forecasters who used those polls to make Election Day projections pegged Clinton’s chances at 99 percent (from the Princeton Election Consortium), 85 percent (from the New York Times), and — on the low end — 72 percent (from the data-crunching site FiveThirtyEight).
“Clinton’s chance of losing is about the same as the probability that an N.F.L. kicker misses a 37-yard field goal,” read the New York Times story.
Charles Franklin, the director of Wisconsin’s most well-known political poll, the Marquette University Law School poll, says he “feels the pain” of people who felt burned by polling in 2016. The last Marquette poll that year showed Clinton winning Wisconsin by 6 points.
“Errors can occur,” Franklin said. “It’s a very good lesson to us all not to exaggerate the accuracy of polling.”
But Franklin and many of his peers have spent the last four years examining and trying to explain what happened in 2016.
They argue 2020 will be different.
What Pollsters Have Changed Since 2016
First of all, it’s important to note something many pollsters are keen to mention whenever you bring up 2016: Nationwide polls were largely correct that year.
And that is true. A RealClearPolitics average of national polls just before Election Day showed Clinton winning the national popular vote by about 3 percent. She ended up winning it by 2 percent.
Of course, the national popular vote doesn’t translate to winning the White House. Clinton’s vote totals weren’t enough in many states to win their Electoral College votes, thereby dooming her bid for the presidency.
State-level polls in 2016 were a different story. Over the past four years, experts reached an academic consensus about those polls’ biggest flaw: a failure by many to “weight for education.”
“Weighting for education” is an attempt to compensate for the fact that college-educated people are both more likely to respond to polls and more likely to be Democrats. A poll that’s weighted for education takes responses from people without college degrees and gives them more “weight,” so the poll more accurately represents the demographics of the place it’s trying to survey.
Pollsters call thousands of people, but many don’t answer their phones. Of those who do answer and take the survey, 60 percent have a college degree. But here’s the problem: only about 30 percent of Wisconsin’s population has a college degree, according to the U.S. Census.
If the poll published those results without any adjustments, it would disproportionately represent the opinions of college-educated voters, who tend to be more liberal than their neighbors without college educations.
So, the poll takes the responses from the people without college degrees and gives them more “weight,” until the demographic ratios in the poll align with the demographics of the state.
According to Ashley Kirzinger, associate director of public opinion and survey research at the Kaiser Family Foundation and a member of the American Association for Public Opinion Research’s poll transparency project, a number of state-level polls didn’t weight for education in 2016.
But she said many have now course-corrected.
“If polls get it wrong this year, it’s not going to be because they weren’t weighting for education,” Kirzinger said.
According to an analysis of 2020 state-level polls by the New York TImes earlier this year, 46 percent of the more than 30 state-level polls released between March and May weighted for education, compared to 20 percent in 2016.
The Monmouth Poll, a survey based out of Monmouth University in New Jersey that does state-level polls in closely watched states like Pennsylvania, Florida and Arizona, along with a number of others, was one poll that made the switch.
Patrick Murray, director of the poll, said Monmouth hadn’t weighted for education before because it didn’t believe there was accurate data available about education levels in certain states. Murray also said in an email interview that, “prior to 2016 there was no significant difference between how people with and without a college degree voted.”
“The latter condition changed dramatically in 2016,” he said.
Now, Monmouth weights for education using self-reported data from respondents, along with U.S. Census data.
According to Franklin, the Marquette University Law School poll has always weighted for education (among other things, like age). He says if his poll hadn’t weighted for education in 2016, its final October 2016 prediction of a 6-point Clinton win would have been even further off.
“It helped us be less wrong than we would have been,” Franklin said.
He said, as it turns out, the Marquette poll — and many others — had other major factors to contend with in 2016.
Complicating Factors In 2016: Undecided Voters And Turnout Changes
In the final Marquette poll of 2016, which was done about a week before Election Day, Clinton led by 6 points among likely voters. But 7 percent of likely voters said they were undecided — that includes people who said they wouldn’t vote for any of the candidates provided by the pollster and those who refused to answer.
Ultimately, those undecided voters broke heavily for Trump, according to exit polls on Election Day and a number of post-election studies, including a comprehensive review of 2016 polling by the American Association for Public Opinion Research.
In a press conference about the AAPOR study, Courtney Kennedy, director of survey research at Pew Research Center, said undecided voters typically split down the middle between the two major party candidates. In 2016, that wasn’t the case.
“In 2016, they broke decidedly for Donald Trump,” she said.
However, a number of studies have refuted the “shy Trump voter” theory. Many experts argue if shy Trump voters existed, polls conducted online, which feel more anonymous, would have shown different results than polls done over the phone.
“If there was a single methodological flaw (with polls), like shy Trump voters, we should have seen the electronic polls were right and others were wrong,” Franklin said.
Aside from the Trump-heavy swing of undecided voters, unpredictable voter turnout is considered the second notable complicating factor for some state-level polls in 2016.
“(Turnout is) not the largest of the reasons, but it was definitely a factor,” said Andrew Mercer, a senior research methodologist at the Pew Research Center.
Franklin said the Marquette poll’s biggest miss in that area was underestimating turnout in the Republican strongholds outside Milwaukee: Waukesha, Ozaukee, and Washington counties — known as the “WOW counties.”
“There’s a lot of people who came home to Trump in the end and that partly goes to people who were undecided, especially in that region,” he said.
The AAPOR study found that turnout was also higher than many state-level pollsters expected in rural communities across the country, because their polls were using data from 2012 to predict turnout and 2016 followed a very different trajectory.
“In 2016, turnout nationwide typically grew more in heavily Republican counties than in heavily Democratic counties, relative to 2012,” the study read. “A number of polls were adjusted to align with turnout patterns from 2012. Based on what happened in 2016, this adjustment may have over-estimated turnout among, for example, African Americans, and under-estimated turnout among rural whites.”
In Wisconsin, for example, turnout among Black voters in Milwaukee dipped drastically — about 19 percent — from 2012 to 2016, according to a study from the liberal Center for American Progress.
Some have chalked that decline up to Clinton’s low favorability ratings in Wisconsin and a corresponding lack of voter enthusiasm. Others have pointed to the pre-Election Day projections — born from polls — about Clinton’s high likelihood of winning, arguing some liberal voters simply didn’t think their vote was necessary to carry her to victory.
Applying Lessons To 2020
With an understanding of what made things difficult for polls in 2016 and what they’ve changed with the bruising election in their rearview mirrors, consumers of political polls can look at 2020 polls with fresh eyes.
So, what are 2020 polls telling us?
In Wisconsin, the latest Marquette poll showed Democrat Joe Biden leading Trump by 5 points among likely voters, 46 percent to 41 percent. Eight percent were undecided, including people who said they weren’t voting for any of the candidates provided by the poll and people who refused to answer. The margin of error for the poll among likely voters was 4.6 percent.
At face value, this latest Marquette Poll, which was conducted Sept. 30 to Oct. 4, looks fairly similar to the Marquette poll conducted at the closest comparable time in the 2016 race, Oct. 6 to Oct. 9.
That poll showed Hillary Clinton leading Donald Trump by 7 points among likely voters, 44 percent to 37 percent. Seven percent were undecided, including people who chose none of the candidates provided in the poll or refused to answer. The margin of error was 3.9 percent.
In other words, these two polls had similar margins of error and similar numbers of undecided voters. In 2016, the Democrat led by 7 points with 7 percent undecided. In 2020, the Democrat led by 5 points with 8 percent undecided.
But there are two important things to note when putting these polls side by side.
Second, third-party candidates were getting much more support at this point in 2016. That’s significant because more than half of those voters ended up casting their ballots for a major party candidate instead — and mostly for Trump.
In the 2016 poll from early October, 9 percent of voters said they would support the Libertarian candidate, Gary Johnson. In the 2020 poll, 4 percent of voters said they would support this year’s Libertarian candidate, Jo Jorgensen.
The 2016 poll also showed 3 percent of voters saying they’d support the Green Party presidential candidate, Jill Stein. In 2020, there won’t be a Green Party presidential candidate on the ballot in Wisconsin, because the party failed to meet petition signature requirements.
So a combined 12 percent of voters said in early October 2016 they planned to vote third party. In the end, a combined 5 percent of voters ended up voting for Johnson (4 percent) or Stein (1 percent) in 2016.
There’s no way to know if 2020’s third-party voters will also shift to a major party candidate, but there are fewer of them (a third of 2016’s number, in fact) that could possibly make that switch. That lowers the volatility of this year’s poll.
Aside from the Marquette poll, there is a new local, statewide poll in Wisconsin this year, the 2020 Election Survey from the Elections Research Center at the University of Wisconsin-Madison. Like Marquette, this poll weights for education. Its latest results are similar to Marquette’s latest, showing Biden leading Trump by 4 points among likely voters, with a 4.5 percent margin of error.
Of the out-of-state pollsters running state-level polls in Wisconsin, many — like Siena and Ipsos — are weighting for education as well. Those showed Biden leading Trump by 10 points (margin of error 4 percent) and 7 points (margin of error 4.7 percent) in their latest surveys of likely voters, respectively.
Ultimately, it’s important to remember the obvious: polls are never going to be crystal balls.
Mercer, of the Pew Research Center, said some of the newfound skepticism of polling in 2020, spurred by 2016, is “probably healthy.”
“People are recognizing that polling results now … there’s no guarantees there,” he said.
But he also urges people not to go too far with their skepticism, and to appreciate polls’ ability to give people a “big picture understanding” of public opinion on issues during elections, not just the status of the race between candidates.
Mercer also encourages people to look for the signs of a good poll before they accept its findings. He said, in general, a poll that is transparent about its margin of error, number of people surveyed, number of days in the field and, of course, what factors it weights responses by, tends to be a reliable and well-done poll.
Kirzinger of the Kaiser Family Foundation said pollsters are trying very hard this year to avoid the outcome in 2016: a lot of surprised people, some of whom felt irrevocably burned by polls.
“There’s a lot of incredibly smart people trying to do this right,” Kirzinger said. “Nobody wants to get this wrong.”
Listen to the WPR report here.
Polls Missed The Mark In 2016. But Experts Say Things Are Different In 2020 was originally published by Wisconsin Public Radio.
More about the 2020 General Election
- Senator Agard Statement on Senator Knodl’s Continued Relitigation of the 2020 Presidential Election - Dane County Executive Melissa Agard - Aug 29th, 2023
- Report Calls For Criminally Charging State’s Fake Electors - Henry Redman - Dec 19th, 2022
- Vos Withdraws Subpoenas, Ends Gableman Probe - Henry Redman - Aug 30th, 2022
- Judge Blasts Gableman Probe, Deleted Records - Henry Redman - Aug 17th, 2022
- Vos Fires Gableman, Ends Election Probe - Shawn Johnson - Aug 14th, 2022
- Judge Orders Gableman To Pay $163,000 In Legal Fees - Rich Kremer - Aug 2nd, 2022
- Prosecute 2020 Fake Electors, Advocates Demand - Erik Gunn - Aug 1st, 2022
- Trump Calls For Nullification of Wisconsin’s 2020 Election - Henry Redman - Jul 12th, 2022
- Legal Fight Over Gableman Probe Keeps Growing - Shawn Johnson - Jun 30th, 2022
- Back In the News: Fake Elector Scheme Dogs Ron Johnson - Bruce Murphy - Jun 28th, 2022
Read more about 2020 General Election here


It all comes down to turnout. In 2012, more than 3 million Wisconsinites voted as compared to about 2.7 million in 2016. If turnout from MKE and Dane plus other urban counties revert to 2012 with 70% of eligible voters going to the polls, it is hard to see how Trump can win here. African American enthusiasm to vote is also high, with grass roots organizers pushing the vote, unlike in 2016. While enthusiasm for Trump is still deep it may be less broad and the undecideds less likely to break so decisively for Trump.