Where Are City’s COVID-19 Hotspots?
Big change as south side census tracts now have far higher rate than on North Side.
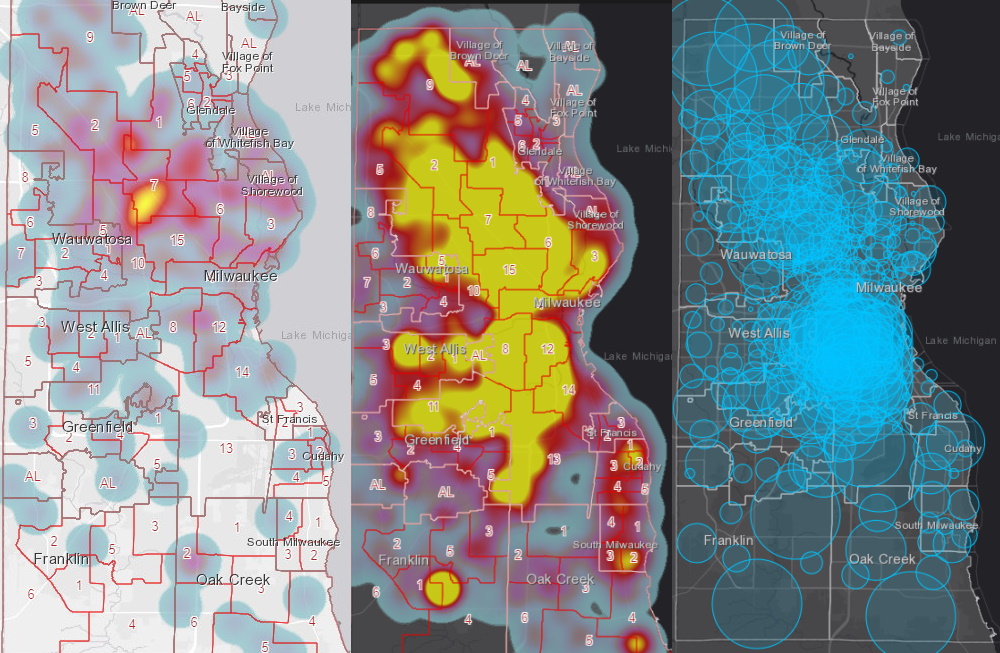
A March 2020 heat map (left), a May 2020 heat map (middle) and a May 2020 case map (right). Images from Milwaukee County COVID-19 Dashboard.
For over two months, the city of Milwaukee has been home to the greatest number of COVID-19 cases of any Wisconsin community. But the actual areas of the city with the greatest number of cases has changed, and with it the racial and ethnic communities most impacted.
As of late March the approximately 200 cases in the city were overwhelmingly clustered in the city’s African American community, primarily those residing in the Sherman Park, Sunset Heights and Saint Joseph neighborhoods.
At the time 70 percent of those with the disease identified as black in a city where 40 percent of residents are black, 37 percent white and 17.3 Hispanic or Latino.
That percentage has now been turned on its head and blacks are underrepresented, but only because of the rapid spread through another community.
By mid-April the fastest-growing cluster was located on the city’s South Side. With approximately 1,500 cases in the city, 160 were in the heavily Hispanic 53215 ZIP code. The percentage of cases in the Hispanic and Latino community was surging, even before the city and Wisconsin National Guard established new community testing sites.“It takes time to conduct the investigation, to connect the dots,” said Milwaukee Health Commissioner Jeanette Kowalik in April. But there was one connection she did make clear at the time: both COVID clusters were in communities that have suffered from longstanding racism and inequity.
On May 22nd, when the 53215 ZIP code now had over 1,000 cases, she highlighted another factor impacting the South Side. “Some of this is an artifact of these employer-related infections,” said Kowalik. The Milwaukee area has seen a number of outbreaks at places of employment, including Cargill in the Menomonee Valley and Smithfield Foods in Cudahy. Food processing plants have historically employed a large number of Hispanics or Latinos with entry-level skillsets who live in the city.
As of May 25th, 5,047 city residents have tested positive for COVID-19, and while new cases continue to appear across the city, the southside cluster continues to grow faster than the rest of the city.
According to a city dashboard, 35 percent of residents with confirmed COVID-19 cases identified as Hispanic or Latino even though they make up less than 18 percent of the city’s population.
Blacks now represent only 36 percent of cases. Individuals identifying as white make up only 11 percent of cases despite representing 37 percent of the city’s population.
Where Are The Cases?
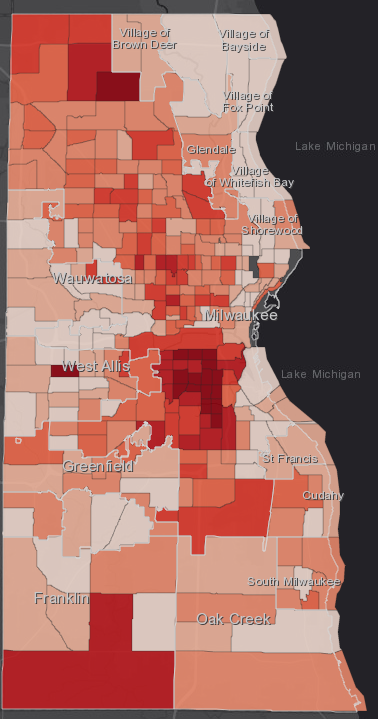
Milwaukee County per-capita COVID-19 map. Image from Milwaukee County COVID-19 dashboard.
“When you’re looking at the county map, it’s a lot of information,” said Kowalik on May 21st.
A Milwaukee County public dashboard maps all of the cases by home residence, but the amount of data is now overwhelming the usability of the map.
Milwaukee County provides location data down to the census tract.
The five tracts with the highest concentration are all located on the city’s southside in ZIP codes with majority Hispanic or Latino populations. Many of the tracts border S. Cesar Chavez Dr. and four of them are in the 53215 ZIP Code.
We included the partially-overlapping, city-designated neighborhoods for context.
The top five:
- Muskego Way – Census Tract 16900 – 2,754 per 100,00 residents (101 cases)
- Lincoln Village – Census Tract 17500 – 2,605 (105 cases)
- Clarke Square – Census Tract 15800 – 2,509 (65 cases)
- Polonia and Morgandale – Census Tract 20500 – 2,468 (76 cases)
- Walker’s Point – Census Tract 16400 – 2,465 (108 cases)
Sixth on the list is a census tract (tract 0700) covering the city’s far northwest side that overlaps with the Bradley Estates and Brynwood neighborhoods. It’s the first majority-black census tract on the list. It also contains the Villa at Bradley Estates nursing home, one of eight such facilities in the city with at least one confirmed case. The tract has 2,388 cases per 100,000 residents (85 cases).
What about the area that was originally a hot spot? You would have to get to 17th on the list today to find one of the census tracts. A tract covering the far eastern portion of the Sherman Park neighborhood, near N. 35th St. and W. Center St., has 1,890 cases per 100,000 residents (20 cases).
Almost every census tract in Milwaukee has a case rate greater than the state average of 269.7 cases per 100,000 residents. The lowest is one covering much of the Cambridge Woods neighborhood near UW-Milwaukee with only 36 cases per 100,000 residents.
You can interact with all of the data, see individual census tracts and more on the Milwaukee County COVID-19 Dashboard.
If you think stories like this are important, become a member of Urban Milwaukee and help support real, independent journalism. Plus you get some cool added benefits.
More about the Coronavirus Pandemic
- Governors Tony Evers, JB Pritzker, Tim Walz, and Gretchen Whitmer Issue a Joint Statement Concerning Reports that Donald Trump Gave Russian Dictator Putin American COVID-19 Supplies - Gov. Tony Evers - Oct 11th, 2024
- MHD Release: Milwaukee Health Department Launches COVID-19 Wastewater Testing Dashboard - City of Milwaukee Health Department - Jan 23rd, 2024
- Milwaukee County Announces New Policies Related to COVID-19 Pandemic - David Crowley - May 9th, 2023
- DHS Details End of Emergency COVID-19 Response - Wisconsin Department of Health Services - Apr 26th, 2023
- Milwaukee Health Department Announces Upcoming Changes to COVID-19 Services - City of Milwaukee Health Department - Mar 17th, 2023
- Fitzgerald Applauds Passage of COVID-19 Origin Act - U.S. Rep. Scott Fitzgerald - Mar 10th, 2023
- DHS Expands Free COVID-19 Testing Program - Wisconsin Department of Health Services - Feb 10th, 2023
- MKE County: COVID-19 Hospitalizations Rising - Graham Kilmer - Jan 16th, 2023
- Not Enough Getting Bivalent Booster Shots, State Health Officials Warn - Gaby Vinick - Dec 26th, 2022
- Nearly All Wisconsinites Age 6 Months and Older Now Eligible for Updated COVID-19 Vaccine - Wisconsin Department of Health Services - Dec 15th, 2022
Read more about Coronavirus Pandemic here