Segregation in Milwaukee Area Schools
The data tells a sobering story of racial and economic separation.
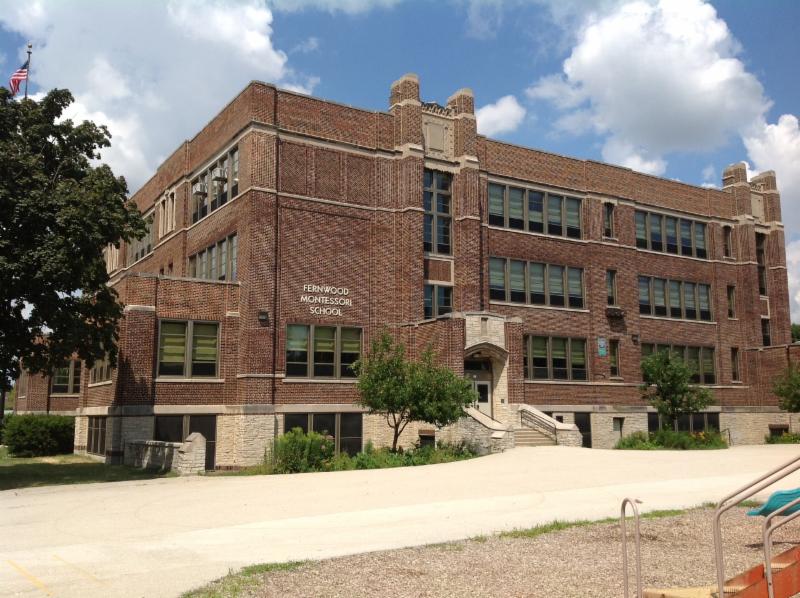
MPS’ Fernwood Montessori School. Photo courtesy of MPS.
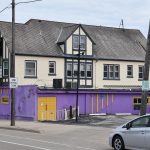
Periodically, the Milwaukee metropolitan area is singled out as one of the most segregated major cities in America. This situation, after decades of trying to integrate area schools, suggests there is a need to take a look at where we are and where we should go from here.
Wisconsin divides the state into 12 Cooperative Educational Service Agencies or CESAs. The CESA 1 area includes Milwaukee and most of its suburbs. It also includes Racine and Kenosha but not the western areas of Racine and Kenosha counties.
The chart below shows the approximate ethnic breakdown of pre-college students in the CESA 1 region, based on school data in the 2017-18 school report card from the Wisconsin Department of Public Instruction. The percentages for each school were averaged. The schools were not weighted for enrollment. The DPI data includes traditional public schools, charter schools, and private schools that accept state vouchers. The latter are given the choice of reporting results based on all enrolled students or only those in the program—or both. If the latter the schools are listed twice.
As the chart shows, white students constitute about 40 percent of students in CESA 1. Black studies are slightly over 30 percent and Hispanics a little more than 20 percent. The remaining 10 percent report belonging to a variety of ethnic groups. In contrast to the rest of Wisconsin, Milwaukee students make up a diverse population at least when it comes to the three largest ethnic groups.
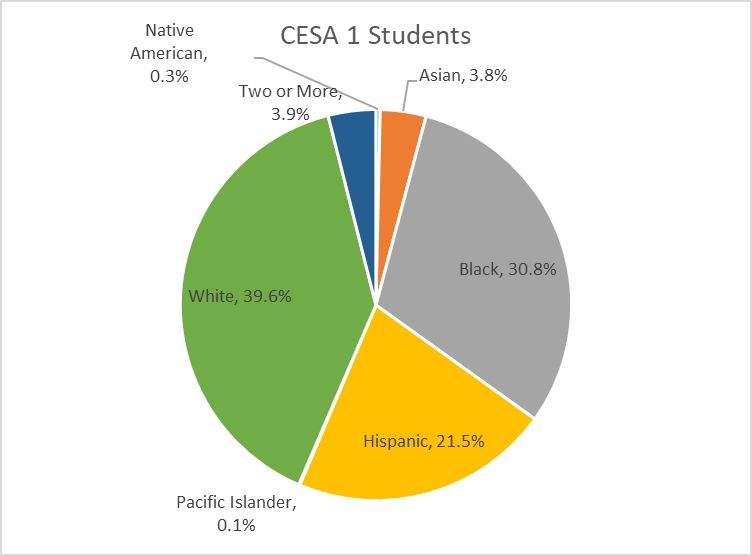
CESA 1 Students
However, while the region may be diverse, most of its 700-some schools are not. The next chart shows the percentage that each of the three main groups make up in the schools. In half the schools, the number of black students—if any—falls below 10 percent. The same can be said of Hispanics. 250 schools have less than 10 percent white students.
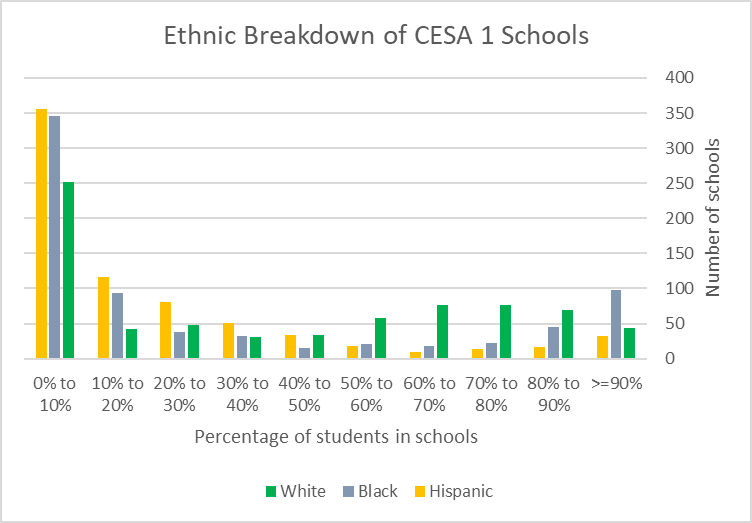
Ethnic Breakdown of CESA 1 Schools
The next chart shows the ethnic breakdown of Milwaukee students. Not surprisingly, black students are a bit more than half, Hispanics are up to 27 percent, and whites are down to about 12 percent.
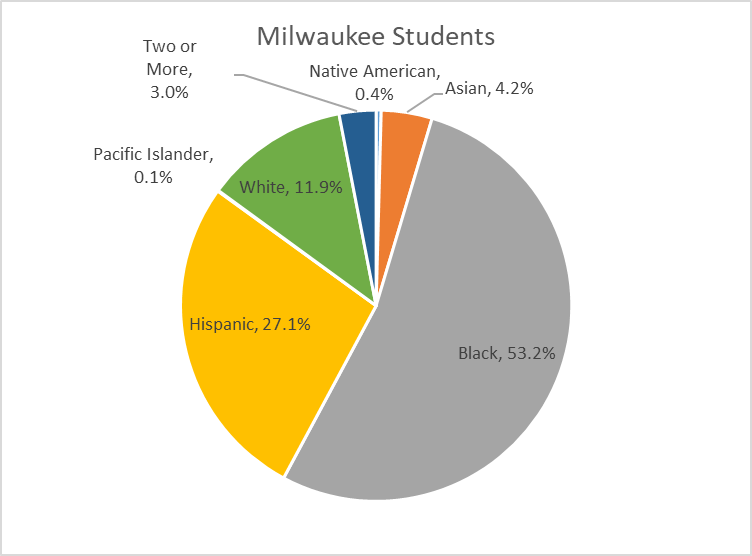
Milwaukee Students
Many schools are dominated by one or another of the three ethnic groups. Of the approximately 240 schools in Milwaukee (again, not just MPS schools), a large number are dominated by one or another of the ethnic groups. At about 60 schools black students make up more than 90 percent of the enrollment. A similar number of schools have under 10 percent black students.
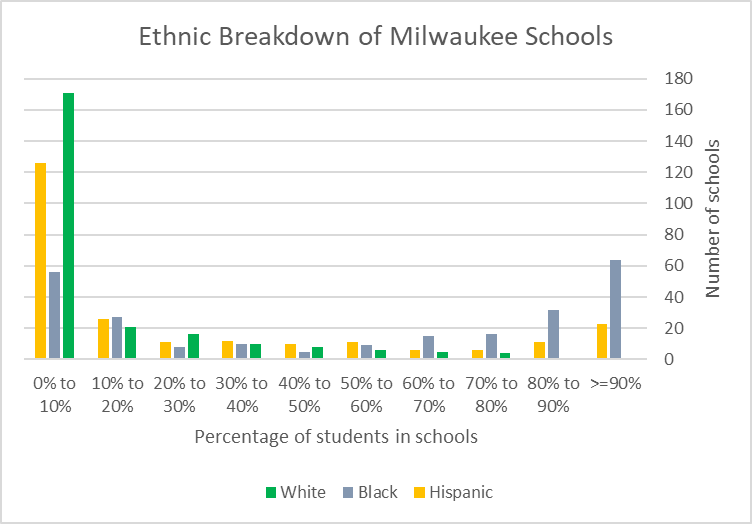
Ethnic Breakdown of Milwaukee Schools
Finally, look at enrollment in suburban schools. To estimate at this, I took CESA 1 enrollment without Milwaukee, Racine and Kenosha. As can be seen in the chart below, white students make up about two thirds of enrollment.
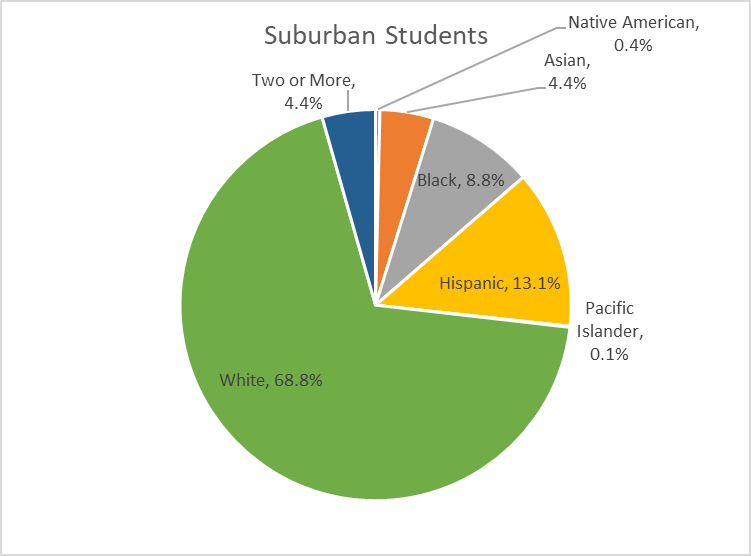
Suburban Students
Most of the approximately 300 suburban schools are predominantly white. At well over half the schools the number of black or Hispanics is under 10 percent and as low as zero.

Ethnic Breakdown of Suburban Schools
In the mid-Twentieth Century, the causes—and therefore the solutions—of segregation were easy to spot. In the South, there were laws aimed at keeping the races separate. In Milwaukee and much of the North, the barriers were harder to spot. They included deed restrictions and restrictive covenants on to whom a house could be sold. It was common for real estate agents to limit the houses they would present based on the buyer’s race.
Within Milwaukee Public Schools, there were strategies to keep black students from sharing schools with white students. These included intact busing, in which students from an overcrowded school in the central city were bused to a less crowded school but kept separate from the white neighborhood students. The system also moved attendance boundaries to keep races separate.
Unfortunately, the optimistic view that removing those barriers would remove segregation did not work out in practice. In the end, the net effect was to shift the boundary between the races from one within the city to one that followed the city limits. The effort to assist students to cross the city limits—the Chapter 220 program—was killed by the Walker administration.A major barrier to desegregation is poverty. Most obviously, poor people cannot afford the housing prices in most of Milwaukee’s suburbs, locking them out. Less obviously, there is increasing evidence of the corrosive effects on children growing up in poverty.
In this light, the current proposal from the Trump administration to impose more restrictions on eligibility for food share program is a step in the wrong direction, further locking people into poverty. If enacted, the gross monthly income limit would be set to $2,252 and household liquid assets at $2,250, according to a letter from state attorneys general arguing against the proposal. This would seem to be a clear message to poor people that they should not attempt to develop their assets.
The danger in talking about poverty, economics, and the effect of children’s environment beyond the schools, however, is that doing so easily becomes an excuse to avoid examining how schools can be more effective. On the other hand, to ignore environmental effects — and the racial and economic separation of children in metro areas like Milwaukee — is to open ourselves to failure. The data clearly shows there is a problem that needs to be addressed.
Data Wonk
-
Who Do You Trust to Conduct Elections Fairly?
 Apr 6th, 2026 by Bruce Thompson
-
Is Non-Citizen Voting a Real Threat to Elections in Wisconsin?
Mar 18th, 2026 by Bruce Thompson
-
How Global Climate Change Affects Milwaukee
 Mar 11th, 2026 by Bruce Thompson