Does the Growing Partisan Divide Make Sense?
As the global economy changed, so did traditional Republican and Democratic constituencies.
Divided Highway. Photo is in the Public Domain.
In its latest post, the Brookings Institution reports that partisan differences between American regions are increasingly reflected in economic differences. As the post’s title says, “America has two economies and they are diverging fast.”
Brookings compares US House Seats won by Republicans in 2008 and 2018 and those won by Democrats in the same two years. One striking difference is that Democratic-voting districts have become much more urban and those represented by Republicans more rural. In 2008, Democratic districts encompassed 39% of U.S. land area compared with the 61% expanse for Republican districts. Ten years later, the Democratic share had fallen to 20% of the map.
Where Republican areas of the country rely on lower-skill, lower-productivity “traditional” industries like manufacturing and resource extraction, Democratic, mostly urban districts contain large concentrations of the nation’s higher-skill, higher-tech professional and digital services.
One result is that Democratic districts are responsible for an increasing share of national output. The graph below compares the Gross Domestic (in millions of dollars) for the average Republican (in red) and Democratic (in blue) US House seat in 2008 and 2018.
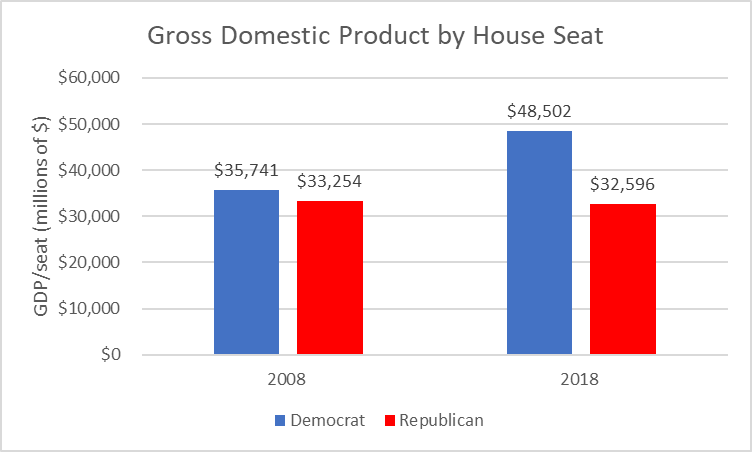
Gross Domestic Product by House Seat
The next graph compares the median family income for Republican and Democratic districts in 2008 and 2017. Ten years ago, average income in Democratic districts lagged slightly that in Republican districts. In 2017, average income in Democratic district was $8,000 more than that in Republican districts, as shown in the graph.
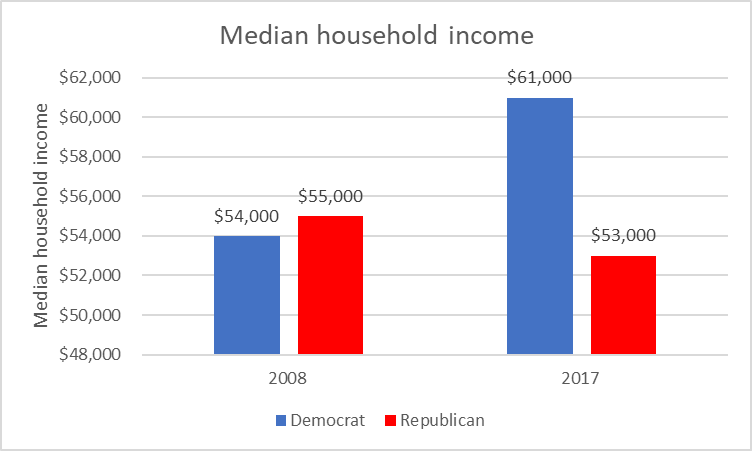
Median household income
The Brookings post runs through a number of other comparisons. For example, the education gap between the two groups of has grown substantially. The share of jobs in manufacturing declined in Democratic districts, whereas it increased in Republican ones. Conversely, the professional and digital services job share increased in the Democratic districts and declined in Republican ones.
It is unclear how much of the effect is caused by districts switching their votes and how due to the differences between Democratic and Republican. For example, the increasing tendency of well-educated people to vote Democratic may cause well-educated prosperous districts to switch from the Republican to the Democratic column. Conversely, districts dependent on struggling enterprises, such as manufacturing, mining, and agriculture have become more likely to vote Republican, particularly with the decline in union membership.To what extent are the national trends identified by the Brookings researches reflected in the Milwaukee metropolitan area? So far, at least, one trend–the increasing success of Democratic candidates in suburbs—seems to have skipped the Milwaukee metropolis. With the exception of some north-shore suburbs, outside Milwaukee itself, the metropolis is solidly Republican.
Consider the three counties that, along with Milwaukee County, make up the Milwaukee statistical area–Waukesha, Ozaukee, and Washington counties—the so-called “WOW” counties. As the next graph, based on votes for governor, shows, these counties are overwhelmingly Republican. In fact, Waukesha County is widely identified as the most strongly Republican large county in the nation.
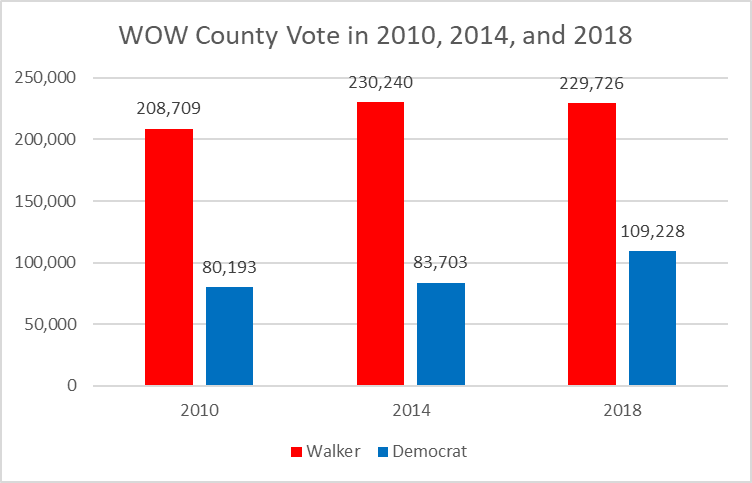
WOW County Vote in 2010, 2014, and 2018
Although results for 2018 hint at a possible lessening of Republican hegemony, the three counties remain overwhelmingly Republican. Waukesha did lose its status (to Washington County) as the county with the highest percentage Republican vote in Wisconsin. Overall, the WOW counties seem to defy the suburban movement to Democrats. (Ironically, Waukesha County has the third largest Democratic vote in Wisconsin.)
Although economically the WOW counties seem to have resisted many of the trends Brookings identified as common to Republican-dominated areas, they share one characteristic, few minority residents. The next chart shows Brooking’s calculation of the average non-white share of the population of Democratic and Republican seats.
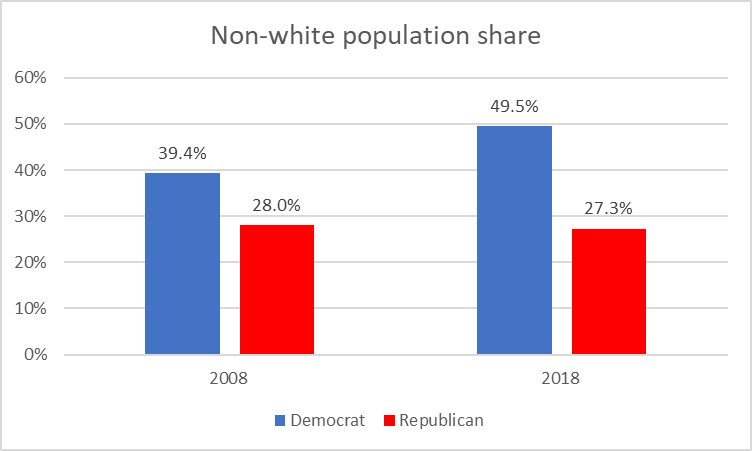
Non-white population share
The next graph summarizes Census Bureau data for the three largest ethnic groups—whites, blacks, and Hispanics in Milwaukee County over the past ten years.
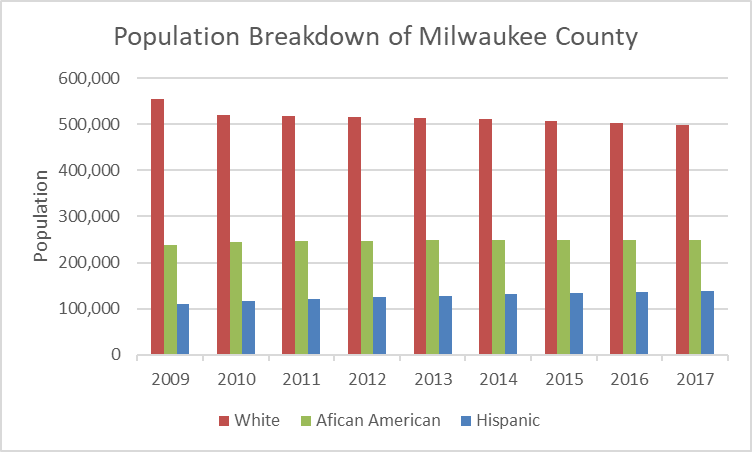
Population Breakdown of Milwaukee County
By contrast, here are the numbers for the same groups in the three WOW counties. If the two charts are considered together, they go a long way to explain why the Milwaukee metropolis is generally ranked as either the most or one of the most segregated cities in the nation.
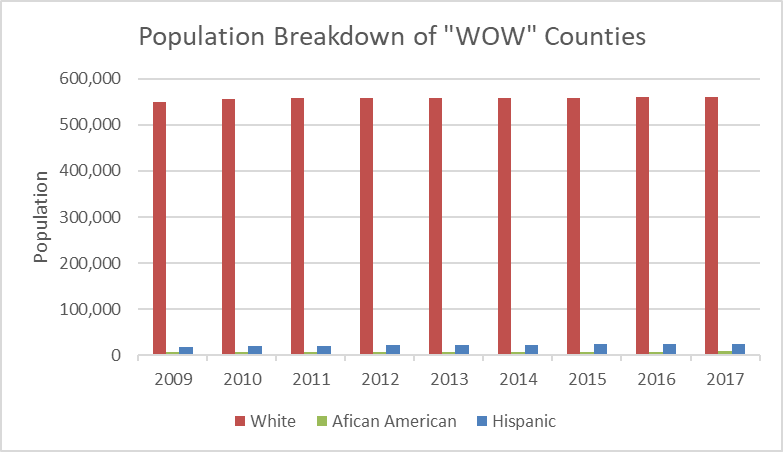
Population Breakdown of “WOW” Counties
The fate of a proposal to add affordable housing in New Berlin may help illustrate why there are so few African Americans and Hispanics in the WOW counties. As explained in a Department of Justice settlement:
Filed in June 2011, the lawsuit alleged that the city of New Berlin blocked a 180-unit affordable housing project that a developer, MSP Real Estate Inc., had proposed for the city center area of New Berlin. The city’s planning commission initially approved the project, but reversed course and denied it weeks later, after hundreds of residents objected to it. The suit alleged that opposition was based partly on racial stereotypes and fear that the project’s tenants would be African-American. The lawsuit also charged that the city, in response to public opposition, changed its zoning and land use requirements to bar affordable housing in the city center in the future.
Outside the Milwaukee area, however, the lesson of the Brookings findings is that Donald Trump territory is increasingly defined as places that have been left behind by changes in the national and global economy. The broader mystery is why. There seems to be a growing mismatch between the needs of these places and the policies promoted by the current administration, such as taking away health insurance or reducing taxes on wealthy people.
Does the growing partisan divide make sense in the age of Trump? In many ways, the WOW counties hark back to an earlier era, when prosperous people moved to the suburbs to avoid the ills, perceived and actual, of the city. To oversimplify, the Republican party that dominated these suburbs was the party of those who were winning in the American economy. Yet Trump’s strength rests on his ability to appeal to voters in areas that are falling behind.
Traditionally the Republican Party was the party of the “makers,” Paul Ryan’s name for the Haves. Trump took control of the Republican Party by his ability to appeal to “taker” or Have-not districts, even while running an administration that favors the “makers.” It is hard to predict the future of such a contraption of contradictions.
Data Wonk
-
Who Do You Trust to Conduct Elections Fairly?
 Apr 6th, 2026 by Bruce Thompson
-
Is Non-Citizen Voting a Real Threat to Elections in Wisconsin?
Mar 18th, 2026 by Bruce Thompson
-
How Global Climate Change Affects Milwaukee
 Mar 11th, 2026 by Bruce Thompson