
Vos and Fitzgerald Trash Urban Voters
Affirming the alignment of Republicans with voters from shrinking counties.

Robin Vos and Scott Fitzgerald.
Following the November Democratic victories in Wisconsin state-wide races, Robin Vos and Scott Fitzgerald justified their lame-duck power grab by trashing voters in Milwaukee and Madison. What do the November election tells us about the voters?
1. Are urban voters real voters?
Assembly Speaker Vos seemed outraged at the nerve of Madison and Milwaukee for stealing the election. According to the Journal Sentinel, he complained that:
If you took Madison and Milwaukee out of the state election formula, we would have a clear majority. We would have all five constitutional officers and we would probably have many more seats in the Legislature.
Ignoring the effects of gerrymandering, he added, “I think we won a fair and square election.”
Not to be outdone, Senate Republican Majority Leader Fitzgerald added in a statement:
State legislators are the closest to those we represent. We spend countless hours each year holding town hall meetings, communicating with local elected officials, and hearing concerns from our constituents. Citizens from every corner of Wisconsin deserve a strong legislative branch that stands on equal footing with an incoming administration that is based almost solely in Madison.
Outgoing governor Scott Walker joined in. The Wisconsin State Journal quoted him as saying, “In no way did I see it as a rejection, but rather just a larger electorate than we’ve ever seen in the past.” The campaign to delegitimize urban voters was striking enough to inspire the New York Times’ Emily Badger to publish an article entitled, Are Rural Voters the ‘Real’ Voters? Wisconsin Republicans Seem to Think So.
The anti-urban campaign continued when Governor-elect Tony Evers began announcing his appointees. Because the first four were from Milwaukee, Vos renewed his attack, complaining, according to the Journal Sentinel, that “Gov.-elect Evers’ outreach plan to take applications from across the state was cause for optimism, which is why I’m so greatly disappointed that his top four appointments were from Milwaukee.”
Rep. Scott Krug, R-Nekoosa, joined in: “DNR and Tourism secretaries from Milwaukee? That’s not very encouraging so far. I’m glad the legislature is full of great voices for rural WI. Doesn’t look so far like the administration will be.”
2. Are Vos, Fitzgerald, and Walker right to blame Milwaukee and Madison for the loss of the statewide offices?
After a close election, lots of interest and demographic groups can claim credit for the victor’s victory. Without their members’ support, the victor would have lost. In this spirit, perhaps the Democratic voters of Waukesha County should claim victory. As the next graph of results in the top six counties shows, Evers received 72,000 votes from Waukesha county. Since he only won by about 39,000, it is not unfair to conclude that Waukesha County put him over the top.
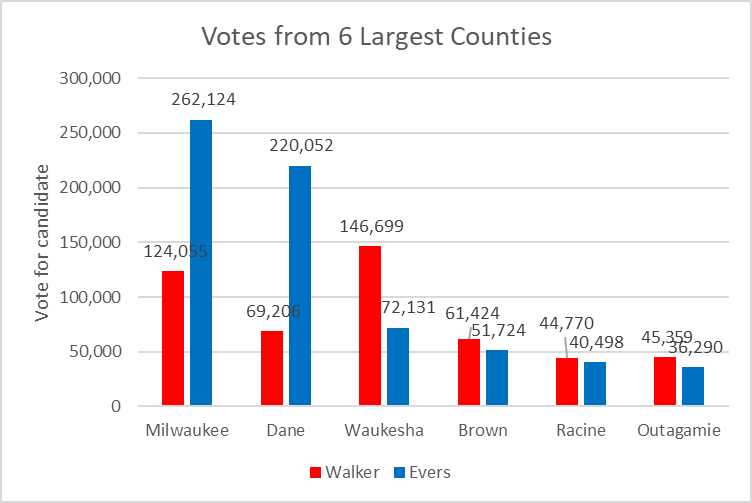
Votes from 6 Largest Counties
Even though Waukesha County votes overwhelmingly Republican, it is the third largest source of Democratic votes in Wisconsin.
By the same reckoning Milwaukee and Dane Counties are the second and third largest source of Republican votes. Given that, it seems particularly misguided of Vos, Fitzgerald, and Walker to trash Milwaukee and Dane County voters.
Wisconsin has 72 counties, but most are quite small. As the next chart shows, the six counties with the largest statewide vote totals contributed over a third (38.0%) of Walker’s vote total and over half (51.6%) of Evers’.
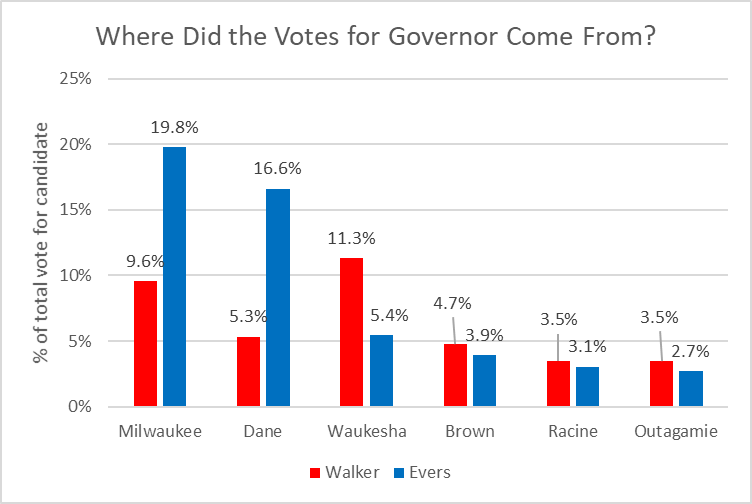
Where Did the Votes for Governor Come From?
Waukesha County is one of the heavily Republican “WOW” counties (Waukesha, Ozaukee, and Washington) in suburban Milwaukee. Like Waukesha, the other two remain heavily Republican, but are growing a bit less so. Compared to the 2014 gubernatorial race, Democratic votes were up by 25,525 in the three counties, while Walker’s votes were basically flat (down by 514).
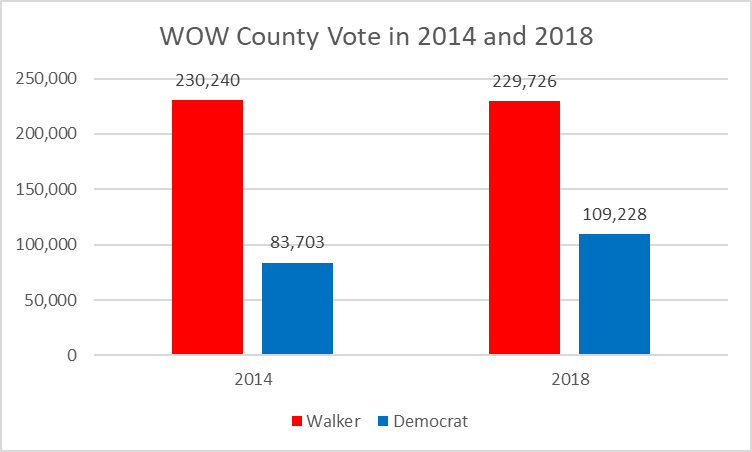
WOW County Vote in 2014 and 2018
3. What does the election tell us about Walker country?
Much of Walker country in Wisconsin (like Trump country nationally) is in deep economic trouble. Start with population loss. The next graph plots the election results on the horizontal axis and the Census bureau’s estimates of population change since 2010 on the vertical. The vertical red line divides counties won by Walker (on the left) from those won by Evers. The horizontal line divides counties that gained population (above the line) from those that lost people.
These lines divide the counties into four quadrants. Particularly notable is the large number of counties in quadrant II, which both voted for Walker and lost population while Walker was governor.
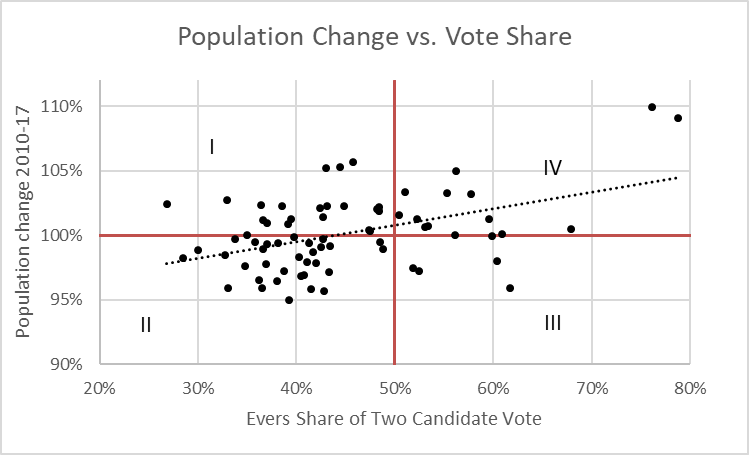
Population Change vs. Vote Share
The next graph summarizes the story. Of Wisconsin’s 72 counties, a majority—38—lost population since 2010, according to Census Bureau estimates. 33 of these voted for Walker.
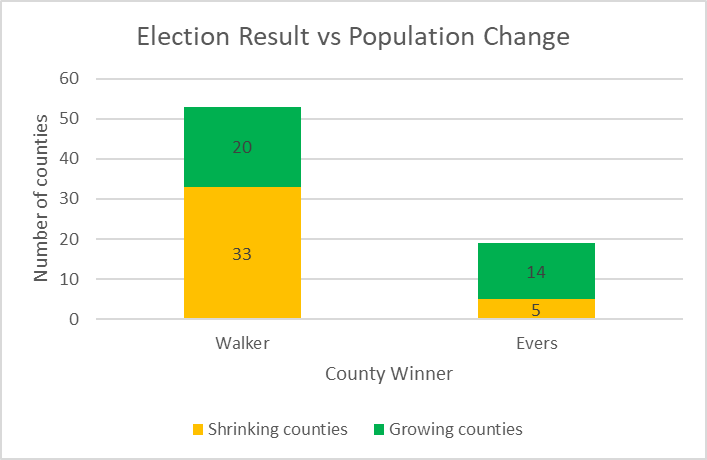
Election Result vs Population Change
4. Does the Republican Party remain the party of the Haves; the Democratic the party of the have-nots?
The next plot compares counties’ gross domestic product per capita (horizontal axis) with their shift in the net Walker vote between 2014 and 2018. Counties losing population are shown by hollow circles; those gaining population by solid circles. The downward-sloping trend line underlines the fact that more prosperous counties shifted away from Walker between 2014 and 2018.
In counties above the dotted black line, Walker’s margin improved in 2018 compared to 2014. Note that most of these also lost residents.
The red line is drawn at -3.4%, the decline in Walker’s vote total between 2014 and 2018. Counties below this line can be viewed as pulling down his margin; those above as pulling Walker’s margin up. Thus, very Republican but prosperous counties like Waukesha and Ozaukee in their shift have been pulling Wisconsin in a Democratic direction.
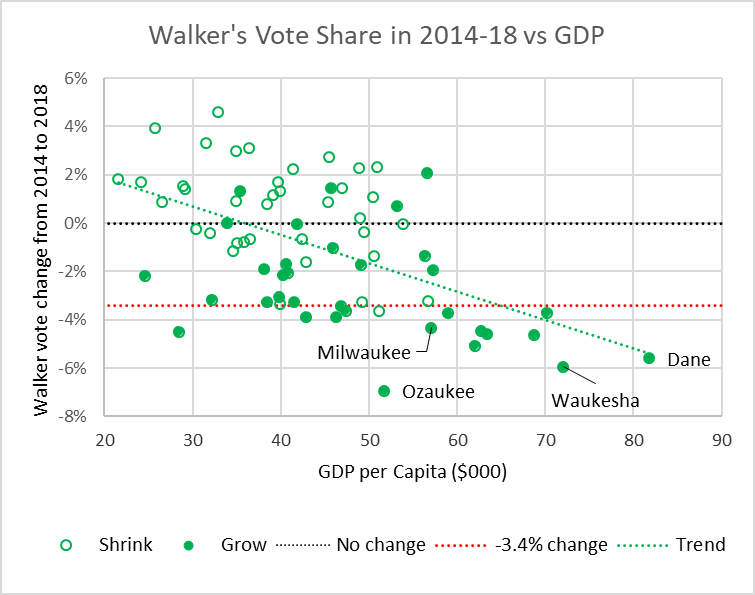
Walker’s Vote Share in 2014-18 vs GDP
It appears that the old generalization that Republicans represent the haves and Democrats the have-nots needs to be reexamined, at least when it comes to geography.
5. Do government transfer programs make people more Democratic?
One of the stories told during the George W. Bush administration was that the economy was divided into “makers” and “takers.” In addition, the nation was nearing a tipping point when the takers—those dependent on government transfer payments—would become a majority and vote for radical expansions of Social Security, Medicare, and other transfer programs. Among those espousing this view were Paul Ryan and Karl Rove, George W. Bush’s political strategist.
The next graph suggests that the opposite holds true. Counties with the largest per capita transfer payments had the greatest shift towards Walker.
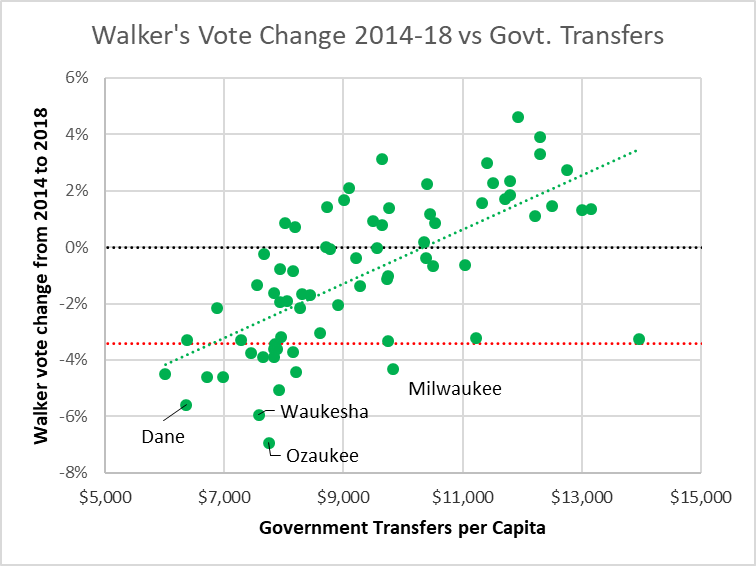
Walker’s Vote Change 2014-18 vs Govt. Transfers
A recent New York Times article found the same phenomenon. It looked at Harlan County, Kentucky, the nation’s fifth most dependent on federal programs. Yet the county had become increasingly Republican as jobs dried up. Far from being grateful for government help, even those most dependent of government help are described as hostile to government and voting for Trump.
What can explain this?
- Demographics: the young leave these counties, so the remaining population is older and more conservative.
- Voters and transfer payment recipients are not the same people. Voters are slightly more prosperous and angry that recipients are getting benefits without working for them.
- Perhaps the growth of government transfer payments in these counties, rather than seen as a help in tough times, is viewed as one more confirmation that the world they knew is slipping away.
Data Wonk
-
Who Do You Trust to Conduct Elections Fairly?
 Apr 6th, 2026 by Bruce Thompson
-
Is Non-Citizen Voting a Real Threat to Elections in Wisconsin?
Mar 18th, 2026 by Bruce Thompson
-
How Global Climate Change Affects Milwaukee
 Mar 11th, 2026 by Bruce Thompson


Nifty charts. But, in the end, it is not about data or proving a point, but about entrenched belief systems and power. The most important of these belief systems is the definition of who “the American people” are. If you listened to any Republican politician over the last 35-40 years, he (with a few “she’s”) has told you that “The American people,” i.e, “those who sent us here,” consists exclusively of white, right-wing, mostly non-poor, suburban and rural Christians.
Everyone else, especially minorities, immigrants, liberals and people who live in cities are not “the American people.” They are “the others.” Vos, Fitzgerald, Walker, Grothman and the gang make this clear every time they open their mouths, including in the comments above. In the process, with the support of ALEC and the state’s plutocratic funders, Wisconsin has been as otherized as any state in the country.
Under the guidance of their corporate heroes, the revered “businessmen,””the American people” have been taught to hate their government, except when it cuts their taxes. And that, with the exception of spending on the military or for paving the road that goes past my house, it is all a waste of “hard earned (white) tax dollars.” All of which they believe go into the pockets of the undeserving. These are people, the leeches, who support “liberals” in an evil compact to steal from the productive ones. That is why the white people of Harlan County, Kentucky and rural Wisconsin, the arch-leeches, in having their snouts in the federal trough, along with the hard-right groups of Waukesha, Ozaukee and Washington counties elect people like Walker, Sensenbrenner, Vos, Fitzgerald and the rest. It is also why the vast corruption and environmental degradation are tolerated.
These outcomes are not about charts, or even electoral results. They are grounded in a firmly held belief in a permanent right to rule by the real “American people” as defined by the Republican Party. It is why voter suppression, gerrymandering, lame-duck system rigging, a U.S. Senate in which 4 senators from states with a combined population of little more than 1 million people have great power, while 4 from states with a combined population of 60 million have little or none, and why the demented, racist nominee of a virtually all-white party can lose an election by 3 million votes and become president, are not only acceptable to the chosen people, the Republican defined “American people,” but an absolute entitlement and a necessity. Charts proving these points won’t change any of it.
These charts are more than nifty; they are telling. They tell us that if the Republicans persist at winning via exclusionary tactics almost exclusively that they may soon exclude themselves from the competition. The 2018 mid-terms suggested that inclusion could become the name of the game in politics soon.