
How Are Our Schools Doing?
Much worse than Chicago’s. And little difference between public and choice schools.
Milwaukee Public Schools Office of School Administration, 5225 W. Vliet St. Photo courtesy of Milwaukee Public Schools.
What do the recently released school report cards tell us about Wisconsin and Milwaukee education? The message can be quite mixed.
The report cards rate schools based on four broad categories:
- Student achievement—how students fared on state math and language tests,
- Growth—how much students gained on the math and language tests from one year to the next,
- Closing gaps—whether the gap between students in a group whose achievement scores lagged behind others was narrowing, and
- On-track and post-secondary readiness.
The actual measures used vary according to what are available. For example, growth is not calculated for high schools because they don’t test students every year. Similarly, to measure the fourth category the graduation rate is used for high schools, whereas attendance and third-grade reading scores are used for elementary schools.
The data can be read to confirm the well-known relationship between poverty and student achievement. The scatter plot below shows the relationship between poverty, on the horizontal axis, and Wisconsin schools’ overall accountability scores. Here, poverty is defined by the percentage of students in a school that qualifies for free or reduced lunch. As the downward-sloping trend line reflects, as poverty goes up the school’s score tends to go down.

Overall Accountability Score-Wisconsin Schools
However, the graph lends itself to a more optimistic interpretation. There is a large amount of scatter. The students at some high-poverty schools outperform students who come from far more prosperous backgrounds.
The same pattern holds if we limit our examination to schools in Milwaukee, as in the next graph.
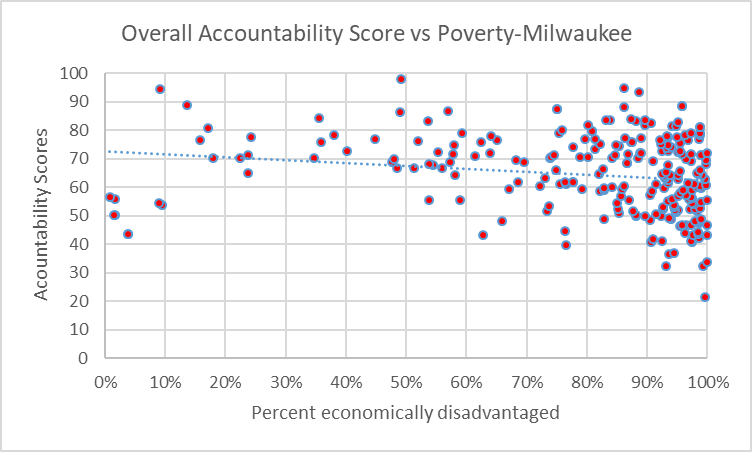
Overall Accountability Score vs Poverty-Milwaukee
Articles about the Milwaukee educational scene often point out the diversity of the legal status of the schools. While the majority of Milwaukee students continue to attend schools run by Milwaukee Public Schools, an increasing number attend private schools, including religious schools, using tuition scholarships through the Milwaukee Parental Choice program. There is also a smaller but growing charter school sector, with three authorizers–UW-Milwaukee, the Milwaukee Common Council and MPS itself.
An awful lot of energy is spent by supporters of one or another of these sectors arguing that their favorite sector is superior to one or more of the others. This energy, in my view, is unproductive. Rather than supporters of MPS lobbying to shut down the Choice program, or attacking charter schools, the children of Milwaukee would be better served if that lobbying were to refocus on improving MPS outcomes. Likewise, supporters of the Choice program have been too accepting of Choice schools with poor outcomes.
The next graph shows the overall accountability scores of elementary and middle schools in Milwaukee, from lowest score to highest. The schools are color-coded by their legal status:
- Schools operated by MPS,
- Private schools participating in the Choice program. These are shown in different color according to whether they report results for all students or just those in Choice, and
- Charter schools, colored differently by whether they are chartered by MPS.
None of the programs has a monopoly on either the high performing or the struggling schools.
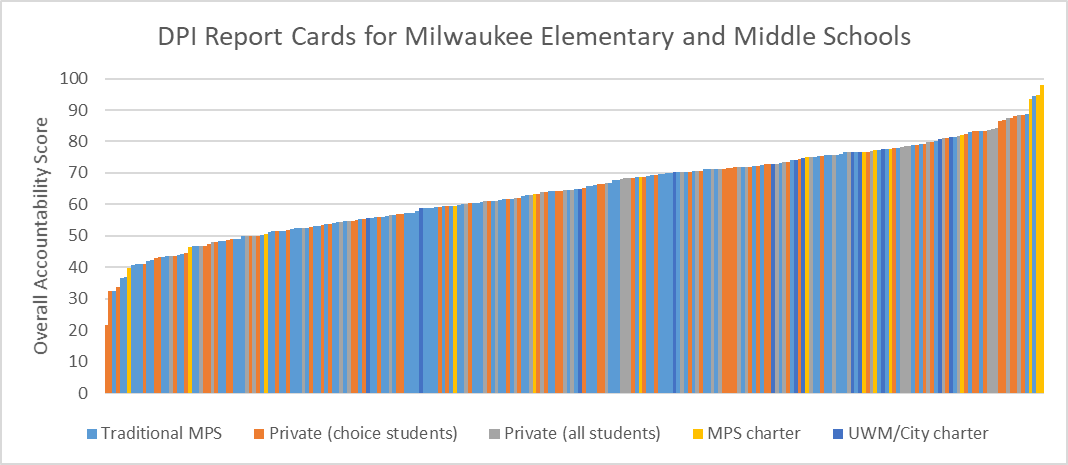
DPI Report Cards for Milwaukee Elementary and Middle Schools
The next chart breaks out the schools run by MPS. From an outcome view, they run the whole gamut of performance, from very successful schools to those woefully behind.
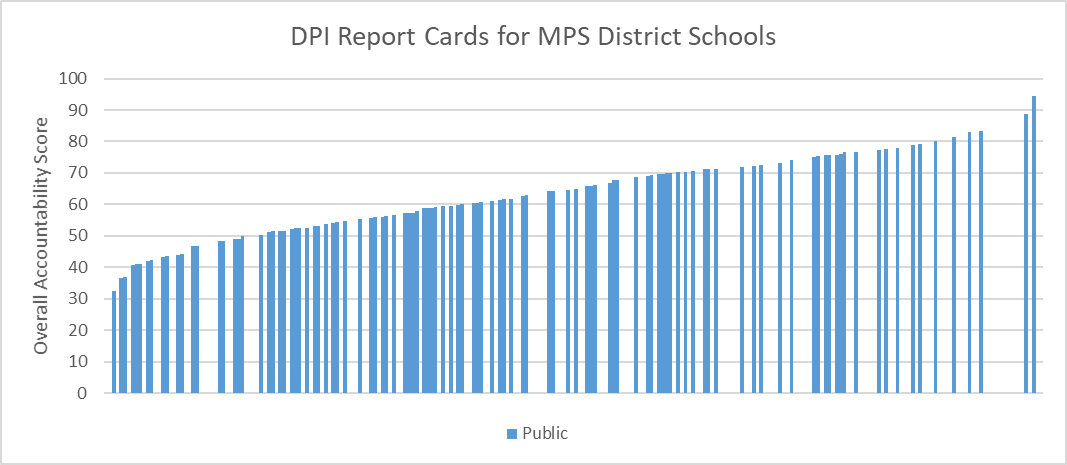
DPI Report Cards for MPS District Schools
The next chart breaks out the results for schools participating in the Choice program. These schools can choose to report data for all their students or only for those participating in the program. I have color-coded them separately because the decision may affect the average they report.
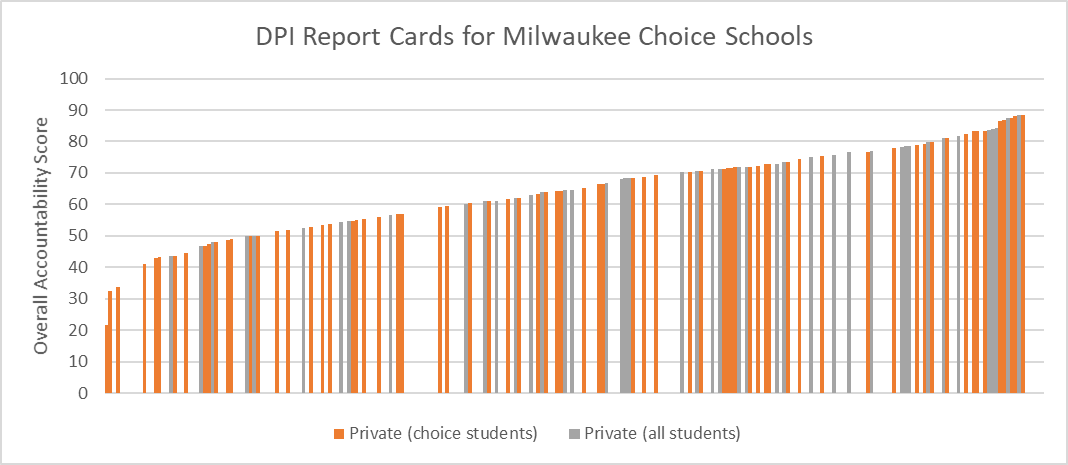
DPI Report Cards for Milwaukee Choice Schools
The final graph of this series shows scores for Milwaukee charter schools. They could be said to be over-represented at the top of the scale, but being a charter is no guarantee of success. Schools shown in blue were authorized by either UWM or the City of Milwaukee. Those authorized by MPS, shown in yellow, come in two varieties: “instrumentality” charters run by the district and “non-instrumentality” charters which are legally separate from the district, with their own boards, and hire their own teachers.
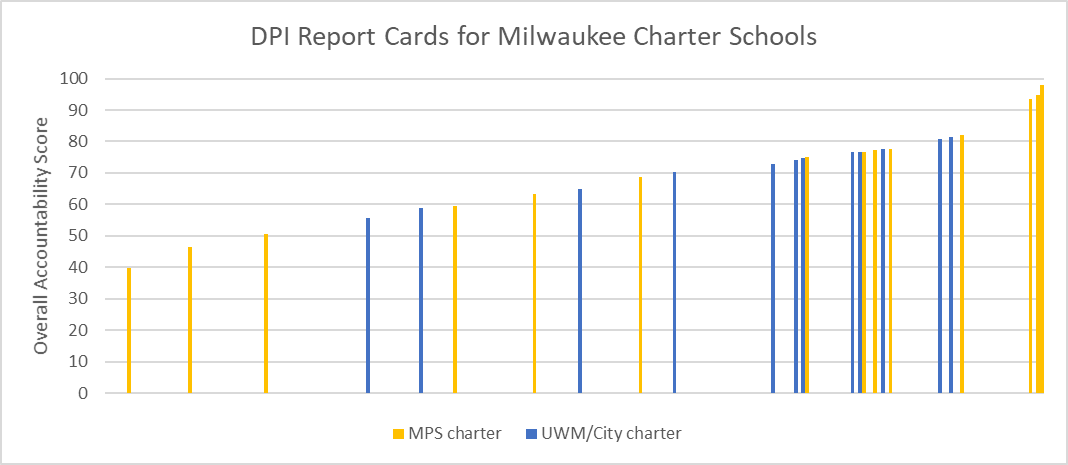
DPI Report Cards for Milwaukee Charter Schools
The next graph shows the mean scores for the five groups of schools. On average, the charter schools score highest. The mean scores for Choice schools are dependent on which students are counted. The mean for traditional MPS schools is slightly below that of schools reporting averages for Choice students.
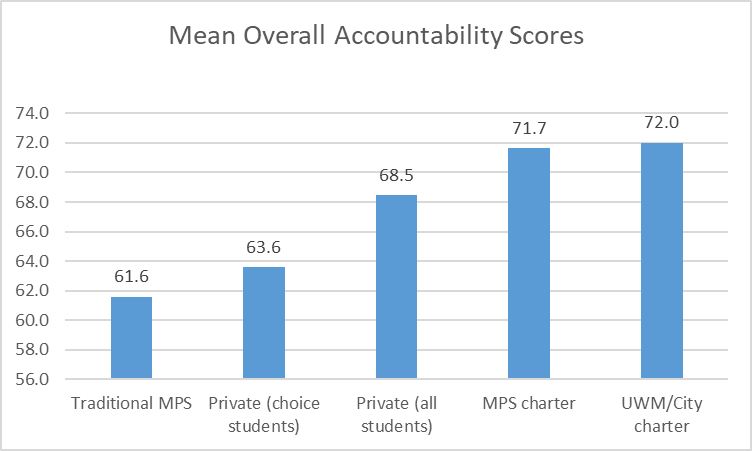
Mean Overall Accountability Scores
The Department of Public Instruction converts the numerical scores into qualitative ratings, as shown below. The average charter school would be rated “Meets Expectations,” falling just short of “Exceeds Expectations. Choice schools on average also fall in the “Meets Expectations” category, while the average MPS student falls just below that.
| Rating | Score |
| Significantly Exceeds Expectations | 82.9 to 100 |
| Exceeds Expectations | 72.9 to 82.9 |
| Meets Expectations | 62.9 to 72.9 |
| Meets Few Expectations | 52.9 to 62.9 |
| Fails to Meet Expectations | 0 to 52.9 |
Because of the differences in measurement, high schools were not included in the previous graphs. The next graph shows the DPI ratings for Milwaukee high schools. Only two of the MPS-administered high schools get a score high enough to rated as “meeting expectations.” Both have admissions requirements, as do the three district high schools with the next highest ratings. Most Milwaukee high school students, particularly those attending MPS non-charter schools, are attending high schools that DPI rates as “Fails to Meet Expectations.”
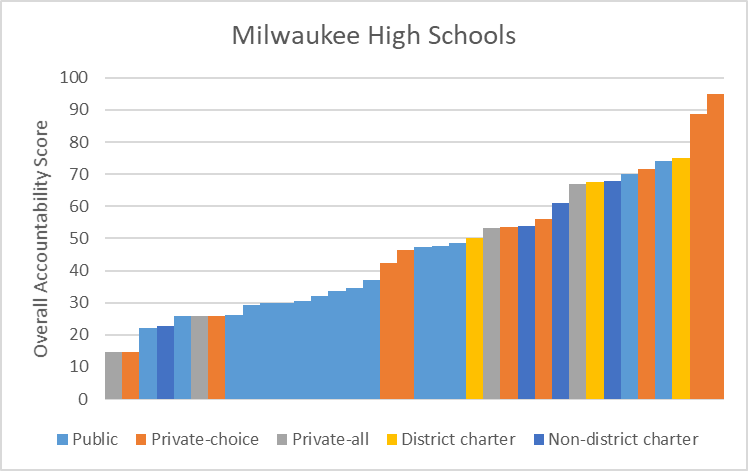
Milwaukee High Schools
The Milwaukee high schools with the highest scores tend to have low enrollments. As can be seen in the graph below, about 70% of the students were in high schools that were judged as failing to meet expectations, the lowest rating that the Wisconsin Department of Public Instruction gives out.
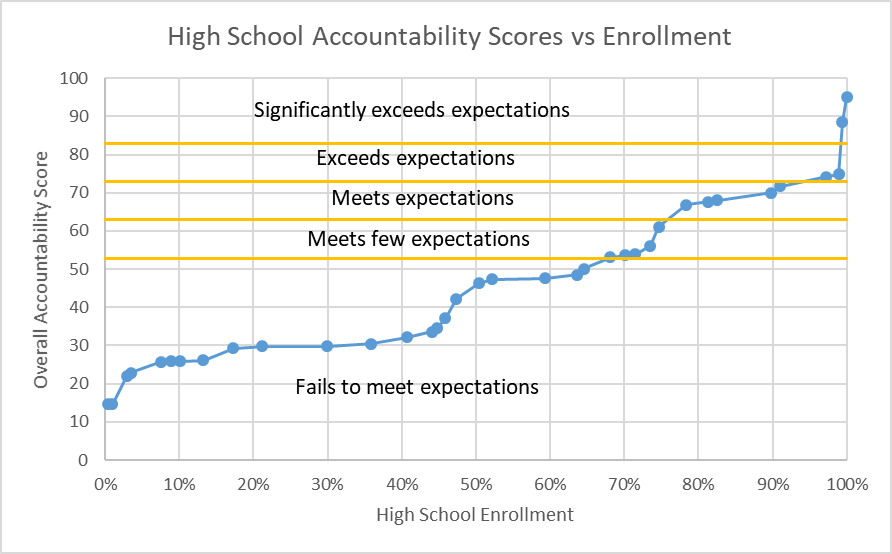
High School Accountability Scores vs Enrollment
One way to view schools is as machines that help create value. Students arrive with one level of skills and knowledge and leave with a higher level. The most successful schools are able to take students who are behind their peers and help them close the gap. High schools are the culmination of that process. The overall record of high school achievement in Milwaukee suggests a system that is stuck.
A recent New York Times article supports that impression. Using a data base of assessments developed at Stanford, it estimates how much the average student in various districts advance over time. Judged this way, the article concludes that Chicago is the nation’s most successful school district. The article treats Milwaukee as Chicago’s foil.
The article calculates that in third grade the average student in Chicago and Milwaukee were between one and two years behind the average third-grader. By eighth grade, however, the average Chicago student had almost caught up to the average eighth grader, gaining 6 years of educational proficiency in 5 years. By contrast, Milwaukee eighth graders were two years behind the average eighth grader, gaining 4.7 years in 5 years.While there are certainly islands of hope in the Milwaukee educational scene, the overall picture is of an educational system that is stuck. As a community we are failing too many of our kids, particularly the most vulnerable ones.
If there is indeed a desire to correct the situation, the first step is to decide on priorities. Is the goal to protect particular institutions and schools or is it to make sure that kids get an education that enables them to be successful members of society?
It is telling, I think, to consider when groups who claim to speak for the community were energized around educational issues in recent years. The first was when Mayor Tom Barrett proposed that he take responsibility for MPS. The second was when state legislation suggested that County Exec Chris Abele might take over one or more failing MPS schools.
As the school report cards show, the relationship between a school’s effectiveness and whether it is organized as a conventional public school, a charter school, or a private school is a very weak one. Unfortunately, this governance issue consumes much of the energy surrounding Milwaukee education. Until this energy is redirected to making every school, of every stripe, effective, systemic improvement will be very difficult.
Data Wonk
-
Who Do You Trust to Conduct Elections Fairly?
 Apr 6th, 2026 by Bruce Thompson
-
Is Non-Citizen Voting a Real Threat to Elections in Wisconsin?
Mar 18th, 2026 by Bruce Thompson
-
How Global Climate Change Affects Milwaukee
 Mar 11th, 2026 by Bruce Thompson


Dump Walker 2018!!
Re-elect Walker 2018! Strengthen penalties against cannabis and other illegal mind-altering gateway drugs!!
Sweet! I have gotten so far under the lying, cheating, stealing, swindeling Wississippi Republican’s skin that they have created an alter-ego!
MISSION ACCOMPLISHED
Next up!
DUMPING WALKER in 2018!! Beep, beep, beep, back ‘er up boys, we got a lot of Wississippi republicans to vote out and DUMP!!
Thanks, a very informative piece, hopefully, with better leadership at the state level in Wisconsin, all schools, public, private, charter, in all areas of the state will prosper, rural, urban, suburban, and mid-size.