Is WisDOT Inflating Traffic Counts in the Hoan Bridge Bicycle Study?
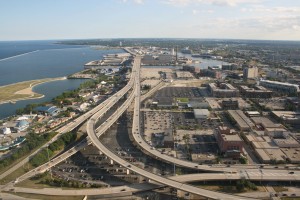
Last week, the Wisconsin Department of Transportation (WisDOT) gave a presentation regarding the possibility of adding a bike trail on the Hoan Bridge. The DOT laid out five potential alternatives, that covered a wide range of costs, and potential impacts such as traffic congestion.
The cheapest option, the $9.4 million version known as Alternative 1A, was clearly the concept on the minds of supporters, because it was the most affordable and realistic of the designs. But the WisDOT report gave this option a ‘level of service’ rating (LOS) of F, likely ruling it out as a viable option in the eyes of WisDOT. When WisDOT talks ‘level of service’ they are determining the level of traffic congestion, which is measured by the density of traffic and traffic flow, or speed. I’m not a traffic engineer, but this ‘level of service’ determination by WisDOT seemed to come to an odd conclusion, and was made using flawed, and even conflicting, assumptions.
In this case, the level of service F grade, as a result of the trail’s construction and lane removal, is predicted to occur in 25 years, for one hour a day, and will result in traffic speeds dropping. According to the report, today normal traffic operation on the bridge is actually speeding. In 25 years? For one hour a day, speeds are projected to drop to 47 mph on the bridge segment while still allowing speeds of up to 54 mph on the ramps. In fact, the two-lane design will still allow for people to speed across the entire bridge during the vast majority of the day, and on the ramps during rush hour. Certainly designing any road for speeding should get an F rating, but that’s not the argument here, as WisDOT rates this an F because they assume a free flowing traffic speed of 60 MPH. Their assumption is that driving 10 mph over the speed limit is the ideal operational state for the bridge. No doubt an odd conclusion. The F grade indicates impending carmageddon, but in reality is merely a projection that people will have to drive near the speed limit for one hour a day.
“The capacity analysis does not assume any traffic diversion to other routes that could result from a permanent capacity constrained 2-lane condition to accommodate a shared-use path on the Hoan Bridge.” In other words, when predicting the future congestion levels for design 1A, WisDOT makes the projections based on the three lanes of travel, and ignores the likely possibility of permanent traffic diversion due to a permanent lane reduction (that the 12% they estimate is diverted currently would stay diverted). The idea that traffic will divert for construction, but not for a permanent lane reduction is questionable, if not contradictory, and calls into question all of the future traffic projections.
Remember that just a few years ago, WisDOT released a document considering replacing the Hoan Bridge with surface level bridges.
Our hope is that WisDOT re-evaluates the traffic projections based on actual traffic counts, and proceeds with Alternative 1A.


When you think of the most life-filled places in the world, the places that are vibrant with human activity of all sorts, one element among many is consistent — a bit of congestion. In some of these places, a good deal of congestion. Yep, it’s a little difficult to get around and that’s actually a factor that contributes to it’s liveliness.
Counter the image above with places that have free-flowing traffic and one primary means of transportation (an automobile). They also tend to display consistent qualities in that they are consistently bland, consistently homogenous, consistently forgettable, and consistently Anywhere, USA.
Traffic Engineers are by and large amongst the worst planners in the world in that they are singularly focused on an issue that actually kills quality of life. It wouldn’t surprise me a bit to hear that WisDOT is misconstruing traffic data to bolster a ridiculous argument. And even if that’s what’s happening, let’s revisit for a moment what this terrible future will hold should we lose a traffic lane: Drivers will have to slow down to 47MPH, for one hour a day, in 25 years. Can you imagine?!
This is a no brainer. Let’s make Milwaukee something other than Anyhwere, USA. Let’s add some complexity, let’s add sense of place, let’s create an amenity out of a bloated piece of infrastructure.
If your whole career and life mission is to move cars, than why should we expect a highway engineer to think positively or even creatively about bicycle and human traffic. This battle is going to be won with constant consumer pressure not looking at DOT to come up with the best idea.
Milwaukee’s population hasn’t grown since the mid 1950’s and in fact has lost about 140,000 people since then. On its face, this seems to fly in the face of ever increasing traffic as the population has clearly leveled off. The flawed assumptions include both a predestined increase in vehicular travel and no improvements to transportation options over time. As with any group of traffic engineers (please, Chris, don’t call them planners), their sole purpose in life is to move cars quickly with no regard to the impact, value or desirability of the place. More forward thinking engineers have begun to study mobility rather than traffic, or in other words actually seeing the forest rather than just the trees. This mobility approach has the benefit of allowing people a choice in how they move around rather than dictating their demise trapped inside the only considered means of conveyance (single occupancy auto). At some point, it is imperative to ensure that the discussion and the priority is about the place rather than how quickly you can move through it. Until then, we are doomed to our asphalt and concrete prison, but at least sometimes we get some rays of cycling sunshine piercing through the bars.
I’m a civil engineer, and I can’t speak for this project in particular, but a general comment… The majority of civil engineers I know work on the infrastructure that supports our car dependent society. They don’t necessarily do it because they want to, but because someone is paying them to complete a project.
If enough ‘urbanists’ go to public meetings / ride their bikes / talk to their elected officials / elect new elected officials / raise kids in the city / direct their friends to cool websites like Urbanmilwaukee.com!… eventually, more money will go to transit / pedestrian / bike projects, and civil engineers will start designing a less car dependent society.
@Michael James thanks we’re trying!
The redevelopment of S. 2nd Street in MIlwaukee is a nice example of the power of persuasion and the outcomes hoped for in this post and comments. We advocates actually did our own traffic counts – and while they were not scientific nor done by trained engineers, they involved actually counting cars regularly during peak hours. And, surprise, a lot fewer cars were counted. The surprising other thing we noted – a lot more bikes were counted than expected too – and this was before the bike lane was added. We also noted the number of buses and how full they were (generally packed, often with bikes in tow). Oh, and even walkers were noted, and there was a sizeable number despite bad weather when we counted. I even had a few skateboarders and runners, just to keep it interesting.
In the end, I doubt us handing in our hand scribbled counts made much difference, but our constant advocacy did. It took time and effort, but it mattered. Interestingly, the DOT was able to “revise” their analysis, after pressure, to support the new direction. The lesson here is that it is key to allow the “planners” cover. Assuming advocacy is successful, they will need to come up with some justification for flipping, other than “these annoying urbanites would not shut up”. So, we didn’t make a big point of the sudden change in analysis on 2nd Street, we just embraced victory.
So, one thematic idea I had for our continued advocacy would be to ask “What would Daniel Hoan want?”. The namesake of the bridge was known as a progressive policy advocate in his day, presiding over the first public bus system and other urban renewal efforts. I bet Mayor Dan would be on bicycle if he were amongst us today.
“So, one thematic idea I had for our continued advocacy would be to ask “What would Daniel Hoan want?”. The namesake of the bridge was known as a progressive policy advocate in his day, presiding over the first public bus system and other urban renewal efforts. I bet Mayor Dan would be on bicycle if he were amongst us today.”
I think this is the best takaway… people respond to the story around the numbers & tend to tune out cold facts.
Dave Schlabowske has a wonderful empirical study that shows just how viable a bike lane is with reduced traffic flow already in place due to current construction. Like Juli’s point, it’s not terribly scientific, but it is demonstrative of what’s really happening on the bridge. While it may be a snapshot, I suspect that one could conduct this study day in and out and find similar results.
http://overthebarsinmilwaukee.wordpress.com/2011/07/20/put-a-bike-path-on-the-hoan-and-the-world-wont-stop-turning/
I always thought highway efficiency was measured at a speed slower than 60 mph, but I could be wrong. Also, adding a bike lane, distributing traffic elsewhere, and likely increasing safety due to slower speeds seems to be good value to me! Thanks for the shoutout on the Switchboard Dave! We still have to hit up the Coin! 🙂
@Chris Yeah Schlabowske’s videos are really telling, of the reality of traffic on the bridge.
@Jason Yes… and yes to the Coin!
So WisDOT is assuming that 6,400 vpd who normally would take the Hoan divert because of lane closures. But how long have the lane closures been in place? I don’t see much change in AADT (annual average daily traffic) in recent years:
Hoan Bridge AADT:
2010: 42,900
2009: 40,100
2007: 40,400
Compare the Hoan to I-43. In 2010, WisDOT recorded 72,800 vpd (AADT) north of Good Hope Rd (on a 4-lane road). Why does the Hoan need 6 lanes for under 50,000 vpd while I-43 handles 70,000 with only 4 lanes?
sources: http://www.dot.wisconsin.gov/travel/counts/docs/milwaukee/milwaukee2010-i794.pdf
http://www.dot.wisconsin.gov/travel/counts/docs/milwaukee/milwaukee-highways2009.pdf
http://www.dot.wisconsin.gov/travel/counts/docs/milwaukee/milwaukee2010-i43n.pdf
@Tom Agreed the numbers they came up with don’t seem in line with the actually counts… very odd
Dont’ forget that the (for-profit) company hired to complete the study is headed by executives who have publicly reported contributions to our anti-bike-lane governor’s campaign coffers. Might provide a motive for the discrepancies.
The lay-man’s engineering in the article is a tad bit on the faulty side. It might be wise to get a better idea of which numbers should be plugged in to the LOS calcs to give you results to base a logical conclusion from. Talking to a professional might provide a better understanding of how to correctly analyze the data. As it is, the conclusion smacks too much of throwing a bunch of numbers in a blender and trying to make sense of the soup in the bottom of your glass.
@Nuclear Art Faulty? I’m curious how I’m wrong? They make estimates based on estimates, which provides a number that is out of line from historical traffic counts. [problem 1] And part of that logic is that traffic was diverted due to a lane reduction. But then for Alternative 1A they don’t make this same assumption (that lane will be diverted due to a lane reduction) [problem 2]. I don’t need to be an engineer to see that flaw in the logic.
Dave, engineering analyses are based on estimates and projections. Engineers don’t close their eyes and pick a number, contrary to the opinion of critics. Projections are based on standard formulas using known quantities based on prior information. That way consistent results can be achieved that have some meaning in the real world. Without a consistent procedure you can’t make equivalent comparisons and would be better off hiring a psychic for the amount of good it does you.
I understand you don’t like the results of the analyses but when you try to shoot them down as “flawed“ without understanding the logic and science behind them you are not doing anyone a service. It’s the same type of attack that the Right uses to discredit their opposition which we all know solves nothing and lowers the bar of meaningful discussion.
Let me just say that your understanding of LOS is wrong and the volumes you pick from various studies are a mixed bag of numbers that shouldn’t be compared the way you are trying. It’s obvious that you are not working through the WISDOT FDM, the TRB Highway Capacity Manual or even the AASHTO Policy on Geometric Design. You are “not an engineer” and shouldn’t make conclusions like you are one. To keep the political analogies going, people who are good at running pizza corporations don’t have the knowledge to run a first world country. Stick with the opinions you may have about the usefulness of bike lines on the Hoan and leave it at that.
@Nuclear Art, The specialization of the engineer is partly why we got neighborhood destroying highways to begin with, so you’ll have to excuse us for being a little leary of their numbers. Sometimes anecdotal evidence like the previous lane closures and video of peak use on the Hoan may just carry more weight than the “logic and science” of the engineer.
@Nuclear Art “Without a consistent procedure you can’t make equivalent comparisons and would be better off hiring a psychic for the amount of good it does you.”
And I’m telling you there is inconsistency in their procedure.
Further, they admitted during the meeting to debating certain assumptions (numbers), which I certainly understand as they are working with unknowns so assumptions have to be made. But, to think that making one assumption this way or that way is irrelevant and won’t impact the outcomes because it is ‘science’. Come on…
Finally, you have yet to point to a specific flaw or mistake in my analysis. Maybe you, or anyone, could explain to me why a temporary lane closure will divert traffic, while a permanent one won’t? Anyone?
@Nuclear Art. I hope it is no transgression for a mere observer to make an observation, while I watch traffic engineers debate assumptions too arcane for the average citizen.
With a bow, I reference a PowerPoint developed by a professor of traffic engineering for a traffic engineering course at the University of Washington. I direct your attention to Slides 8 and 9 of this link.
Professor Muench makes the case (Slide 8) that a moderate speed allows cars to be closer together safely; traffic can then move at a reasonable pace, avoiding the start-stop trigger of congestion. The higher the speed the more likely the congestion.
In Slide 9 note that higher speeds congest earlier under growing volume, then gravitate to a throughput comparable to 50 mph. http://courses.washington.edu/cee320w/lectures/Freeway%20LOS.ppt
Counterintuitively, higher speeds do not deliver significantly more traffic per lane per hour. Using the 4 second gap recommended by WisDOT for following the car ahead, a lane moving at 50 mph will deliver 870 cars, the lane moving at 60 mph delivers only 875 cars (5 more). Shorter gaps deliver a few more cars and maybe a lot more risk.
While our traffic planners “hold the line” on the assumptions they use to get a specific Level of Service, they appear to be a bit casual about their Department’s recommendation for following the car ahead, and, clearly, laissez faire about the law, that speed limit.
(Slide 8) is actually Slide 8 – but I smiled while writing that, so the smiley is accurate, too.