
Has Barrett Driven Up City Debt?
Conservative MacIver Institute says yes. Let’s look at the data.

Mayor Tom Barrett speaking at the groundbreaking for the Northwestern Mutual Tower and Commons. Photo by Jeramey Jannene.
A recent post from the MacIver Institute criticized Milwaukee Mayor Tom Barrett for the magnitude of Milwaukee’s debt. Its argument was summarized in its headline: Debt Driving Milwaukee’s Budget Problems, Not Lack Of State Aid. The report appears to be a response to Barrett’s periodic complaints about huge declines in state aid. The MacIver story’s opening paragraph slaps back at Barrett:
There are two words that characterize every budget in the City of Milwaukee since Tom Barrett became mayor: borrow and spend.
Referring to Barrett, the post argued that:
When he took over in 2004, the city’s annual budget was $856 million. As of 2015, it was $1.5 billion.
MacIver took these totals from 2004 and 2015 reports by the Wisconsin Department of Revenue called County and Municipal Revenues and Expenditures. While the DOA’s 2015 report is consistent with the 2015 Milwaukee budget, the 2004 substantially understates the actual budget. In 2004, Milwaukee spent $1.038 billion, according to its 2006 budget report. Why the state DOA entered the wrong total for 2004 is unclear, but the effect of the error is to greatly exaggerate the increase in Milwaukee’s budget.
Next, the MacIver post talks about annual borrowing:
Annual borrowing went from $90 million to $285 million.
These numbers come from Milwaukee’s Comprehensive Annual Financial Reports (CAFR), for 2004 and 2015. The post includes a link to the page of each year’s CAFR with these numbers.
Did borrowing really go up? The same pages also list the debt per capita for Milwaukee. In 2004 it was $953; at the end of 2015, it was $1,074. Adjusted for inflation, the debt per Milwaukee resident actually declined. How can this be? If Milwaukee is doing more borrowing shouldn’t the total debt have risen substantially? The answer to this mystery is suggested by MacIver’s next claim:
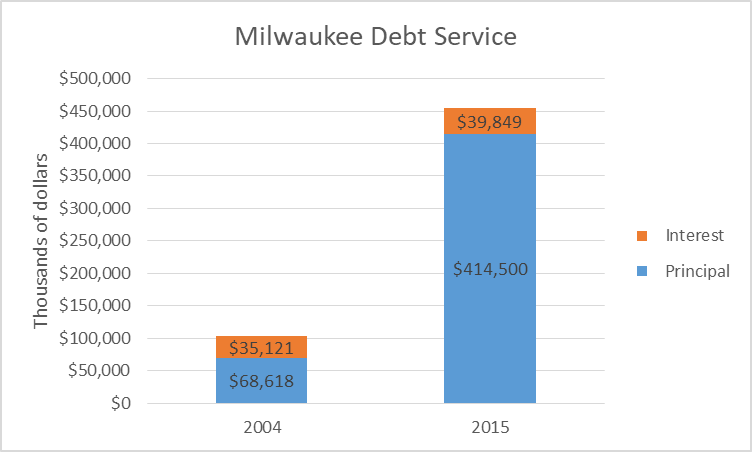
The annual debt service payment went from $103 million to $450 million, a 275 percent increase.
MacIver took these numbers from the DOA’s report on city and county revenues and expenditures. The payments have two parts: principal and interest. As shown below, interest is much smaller than principal, and has grown much less. Usually with debt it is the other way around. With a home mortgage, for instance, most of payments are devoted to interest, particularly at the beginning. To figure out the answer to this mystery I contacted Mark Nicolini, Milwaukee’s budget director, Martin Matson, the independently elected Milwaukee Comptroller, and Richard Lee, Milwaukee’s debt manager.
Milwaukee Debt Service
It turns out that most of the apparent growth in debt is a figment of the accounting rules. Each time Milwaukee refinances its debt—whether to take advantage of lower interest rates or for other reasons—it is required to report that transaction as a new purchase of debt. (Apparently it also artificially inflates the city budget.) Here is the reported debt service, taken from past budget reports:
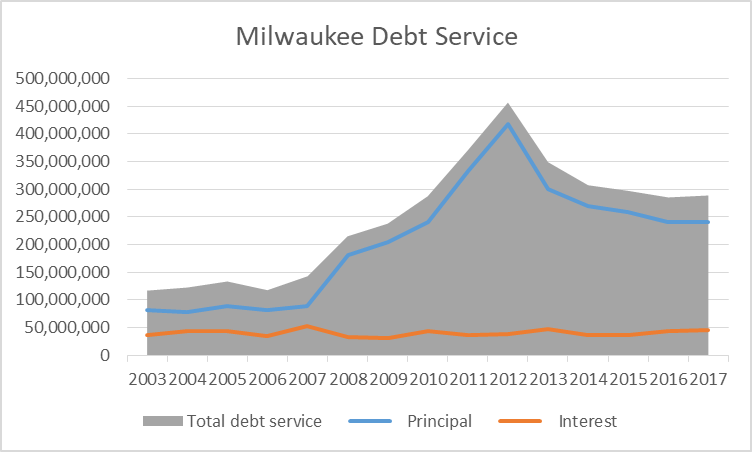
Milwaukee Debt Service
As you can see, the principal seems to have soared, as MacIver reports, yet the interest paid hasn’t changed, suggesting a distorted picture. The next chart shows the actual property tax levy spent on city debt, which has fluctuated a bit from year to year, but overall rose from $55 million in 2004 to $65 million today. In real, un-inflated dollars that’s a decline of nearly 24 percent in the tax levy going to city debt.
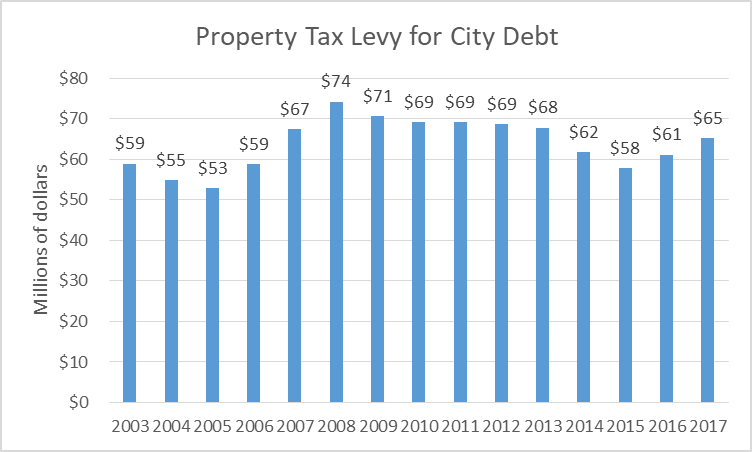
Property Tax Levy for City Debt
This does not mean that Milwaukee residents can be complacent about the city’s debt. As the Public Policy Forum report on this year’s budget concludes:
The City’s capital spending needs are not diminishing – as shown by the fact that the proposed $89.9 million of levy-supported debt to be issued in 2017, while lower than this year, still would greatly exceed the ideal level of $75 million cited in the budget. If levy-supported debt issuances cannot be brought down to that level in the relatively near-term future, then debt service likely will begin to crowd out departmental needs.
The long-term problem for Milwaukee was revealed in a new study by the non-partisan Public Policy Forum which Bruce Murphy reported on yesterday. The study found that Milwaukee is unique among cities of its size for its dependence on only two sources for funding: state aids and the property taxes. Nearly every other big city uses a sales tax or an income tax, which reduces the dependence on the property tax and spreads the tax burden to tourists, commuting employees and others who benefit from city services and amenities. (See On the Money? The City of Milwaukee’s Uncommon Revenue Structure and How it Compares to Peer Cities.)
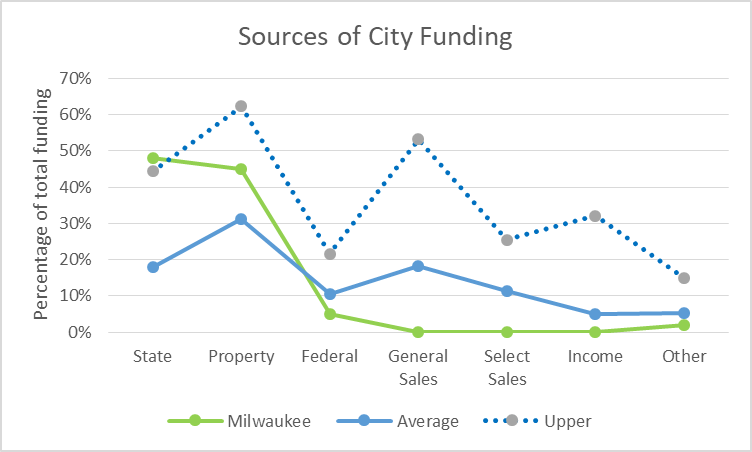
Sources of City Funding
Comparing the Department of Revenue reports from 2004 and 2015 that MacIver references, one can see that state aid for Milwaukee has declined by 5 percent. When adjusted for inflation, this is about a 19 percent decline in state aid for Milwaukee. That might explain why the city would have to increase its debt, but in fact it hasn’t. Instead, as an earlier PPF study found, the city was able to take advantage of “successful efforts to dramatically reduce health care costs, stabilize pension contributions, and trim the active workforce.” But the PPF concludes these short-term fixes haven’t eliminated a long-term problem the city faces, of a “broken” revenue structure too dependent on only property taxes and state aid that has been declining for more than 20 years.
Political Contributions Tracker
Displaying political contributions between people mentioned in this story. Learn more.
Data Wonk
-
Who Do You Trust to Conduct Elections Fairly?
 Apr 6th, 2026 by Bruce Thompson
-
Is Non-Citizen Voting a Real Threat to Elections in Wisconsin?
Mar 18th, 2026 by Bruce Thompson
-
How Global Climate Change Affects Milwaukee
 Mar 11th, 2026 by Bruce Thompson


And to think that some people put any credence in a report from MacIver.
Why the heck is the last graph a line graph? It’s not data over time, it shouldn’t be a line graph.
Bar chart or just the points themselves would be appropriate.
Thanks for looking into that Bruce! This sheds more light on their claims.
This is exactly why Bruce Murphy chastised MacIver and called them as partisan as partisan gets and not to be taken seriously.
Which is also why I asked if he would look into and respond to their claim…
Clearly, the MacIver cabal ought to be renamed the Herr Goebbels Institute, after their apparent leader, who famously said “A lie told once is just a lie, a lie told a 1000 times becomes the truth”.
Good reporting, Bruce: revealing that truth can be clear whereas propaganda tends to be twisted and cloudy.