Redistricting and Democracy
Gerrymandering has eliminated nearly all competitive legislative and congressional districts.
![How to Steal an election. Image by Steven Nass (Own work) [CC BY-SA 4.0 (http://creativecommons.org/licenses/by-sa/4.0)], via Wikimedia Commons.](https://urbanmilwaukee.com/wp-content/uploads/2016/06/How_to_Steal_an_Election_-_Gerrymanderingj.jpg)
How to Steal an election. Image by Steven Nass (Own work) [CC BY-SA 4.0 (http://creativecommons.org/licenses/by-sa/4.0)], via Wikimedia Commons.
The term that political scientists use for this is “asymmetry”: supporters of one party have more difficulty winning seats than do supporters of the other. This allows the party in power to entrench itself and thus frustrate the will of the voters.
There are a number of ways that symmetry can be measured mathematically. The “efficiency” model used by many political scientists counts the number of votes that were “wasted” by each party—those for losing candidates and those for winning candidates that were more than the number needed to win. Testimony in the legal challenge to the Wisconsin gerrymander disclosed that Wisconsin hired a political scientist whose role was to maximize votes wasted by Democratic voters.
The following discussion takes a slightly different tack to measure gerrymandering. I start with the basic principle of symmetry: a perfectly symmetric electoral system is one in which the outcomes are the same if the inputs are the same when the parties are reversed. In other words, if Republicans got Y seats in the legislature by winning X percent of the vote, then if Democrats win the same X percent of votes they would also gain Y seats.
To illustrate, consider the districts that existed at the time of the 2008 election. The two curves show the ability of each party to translate votes into seats. While not identical, they came close. For example, Democrats winning 55 percent of the vote gives them an estimated 70 seats in the State Assembly (out of 99). Similarly, Republicans winning 55 percent of the vote results in 70 Republican seats. Similarly a 50-50 split in overall support results in 50 Republican-leaning seats and 49 Democratic ones.
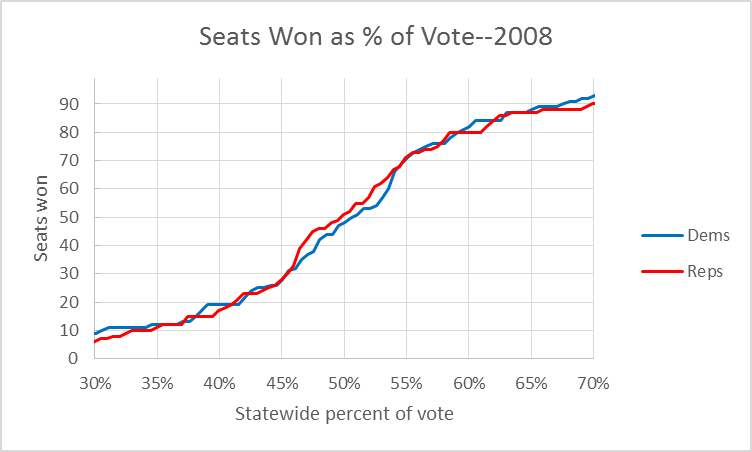
Seats Won as % of Vote–2008
Next, consider the 2012 election, as shown in the next plot, after the 2010 gerrynmander. If Democrats won 55 percent of the vote, they would have captured 50 seats; if instead Republicans won 55 percent of the vote they would have received 67 seats. This effect gives an advantage to one group of voters over another, violating the principal of one person, one vote.
The same asymmetry now continues at other voting levels. If each party won half the votes, Democrats would get 39 Assembly seats, Republicans 60. If instead the Democratic vote share dropped to 45 percent their seat count would fall to 32; yet if Republicans won 45 percent of the vote, they still would get 49 seats, only one short of a majority.
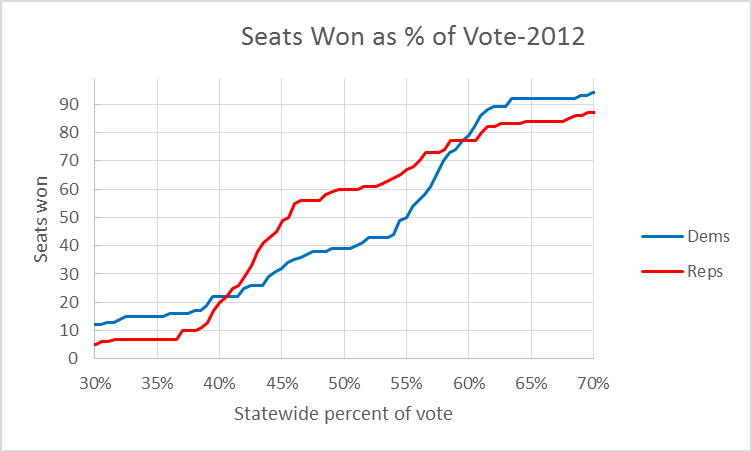
Seats Won as % of Vote–2012
It is possible to quantify the difference. For example, the mean square estimate (MSE), is widely used to choose between forecasting models. It starts with the difference between the model’s prediction and the actual value. It squares each difference and then averages them. A model that perfectly predicted the actual values would have a value of zero. The larger the value the worse the fit.
Applying the MSE to the 2008 Republican versus Democratic seats, it is 7. For 2012 the MSE is 133, reflecting the far greater asymmetry following the gerrymander.
The two plots above illustrate the results of “packing and cracking,” the standard method employed for gerrymandering legislative districts. Start with a competitive district, one with about the same number of Democrats and Republicans. By manipulating boundaries, the number of Democrats in previously competitive districts is reduced to be replaced by Republican voters (cracking). These Democrats are then placed in a district that is already heavily Democratic (packing). The result is a map with a large number of safely Republican districts and a small number of overwhelmingly Democratic seats.
The next step in generating the plots was to take an additional half percent of each district total vote and add it to one party while subtracting it from the other. How many districts would each party capture for each half per cent increment between 30 percent and 70 percent?
Clearly a party may do better or worse than this estimate in a particular district, depending on the skill of its candidate, the amount of resources it puts in, and other local factors. However, the results do give a good estimate of which districts are likely to be in play and which party is likely to win.
In addition to increasing the number of seats in which the advantage favors the party creating the gerrymander, a second aim is to take seats where the party has a small advantage and make it larger. This was true of the Wisconsin gerrymander.
The next graph shows the reduction of competitive districts due to the 2010 redistricting in the Wisconsin congressional delegation, the state senate, and the state assembly. I defined competitive districts as those in which neither party’s advantage exceeds 4 percent when the statewide vote is evenly divided.
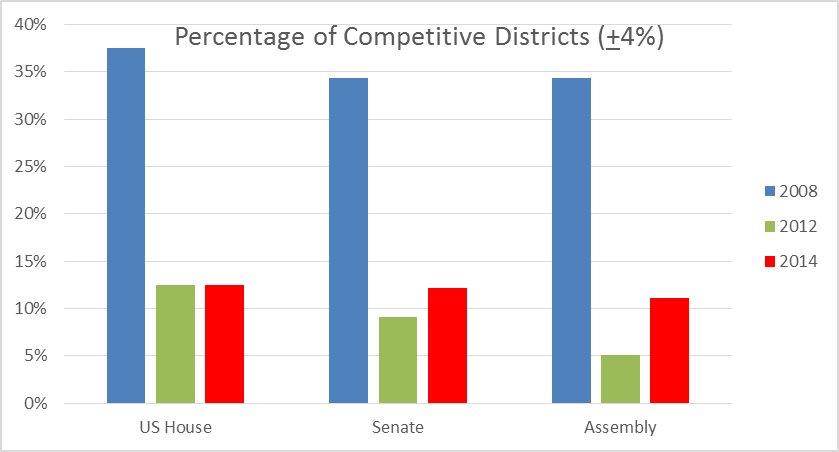
Percentage of Competitive Districts (+-4%)
Using the 4% rule of thumb, the Republican gerrymander reduced the proportion of competitive districts from about one-third in 2008 to a little over one-eighth by 2012. This means that most legislators, at all levels, are safe from a challenger from the other party. The real danger comes from the primary and a challenger who will accuse a legislator who works for compromise as selling out. Gerrymanders in Wisconsin and other states help explain the increasing polarization of American politics.
Some defenders of the Wisconsin gerrymander seem unaware of how much it has reduced competitive districts. In July the Journal Sentinel’s Christian Schneider published a column defending the gerrymander on the basis that Democrats would have done the same thing if they could.
Yet in an August column Schneider described the Eighth Congressional District, centered on Green Bay, as “one of the few truly competitive congressional districts remaining.” For support he referred to Jay Johnson and Steve Kagen, two Democrats who won the District. He added that Barack Obama received 54 percent of the vote in the district in 2008.
Schneider ignores the fact that Johnson and Kagen were successful under the old boundaries, and that in 2012, Obama, while winning Wisconsin 53 percent to 47 percent, lost the Eighth District to Romney 48 percent to 52 percent.
The next chart compares all eight Wisconsin congressional districts in 2008 and 2012. Perhaps Schneider is right that Democrat Tom Nelson, who he describes as “smart, hardworking and has executive experience,” will be able to attract enough Republicans to make the Eighth District competitive, with the inadvertent help of Donald Trump. However, Schneider underestimates the challenge facing Nelson.
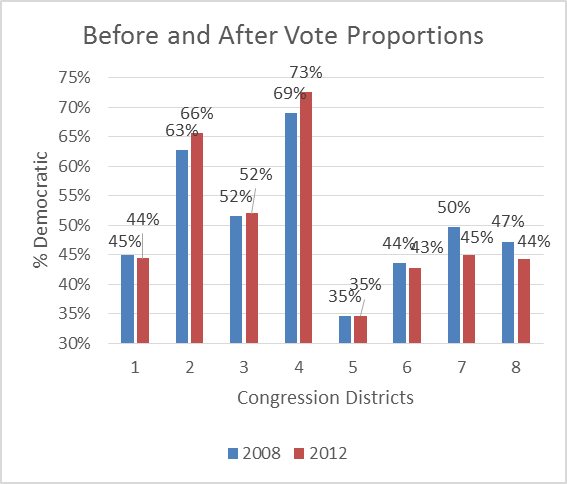
Before and After Vote Proportions
In 2008 there were three competitive districts, one (the Third) slightly favoring Democrats and two (the 7th and 8th) favoring Republicans. By 2012, the gerrymander had turned the 7th and 8th Districts distinctly Republican, leaving only the slightly Democratic 3rd District as a competitive one.
The notion of symmetry underlies Americans’ sense of fairness. We hope that courts, for instance, will make their decisions based upon the law and the facts, not on who the parties are. In practice it is usually hard to test for symmetry when it comes to public policy. Consider the question of whether the Wisconsin Supreme Court might have ruled differently if the John Doe investigation’s target had been coordination between Tom Barrett and various liberal outside groups. Would it have been so eager to rule unconstitutional the Wisconsin law under which the investigation took place?
With most public policy issues, the problem is dealing with “counter factuals,” events that did not happen. To answer the question we need to rewind the tape, insert different characters, and see what happens. The result is speculation. In contrast, with redistricting it is possible to estimate with high confidence what would have happened under different voting scenarios before and after redistricting. What happened is just what the political scientist hired by Republicans was paid to accomplish: a huge GOP advantage that frustrates the will of the voters.
Data Wonk
-
Why Absentee Ballot Drop Boxes Are Now Legal
 Jul 17th, 2024 by Bruce Thompson
-
The Imperial Legislature Is Shot Down
 Jul 10th, 2024 by Bruce Thompson
-
Counting the Lies By Trump
 Jul 3rd, 2024 by Bruce Thompson


Yes the common “but the Democrats do it too or would if they could” defense. This book and interview directly address that. The simple fact is that almost all of the gerrymandering done in America is done by Republicans. http://www.npr.org/2016/06/15/482150951/understanding-congressional-gerrymandering-its-moneyball-applied-to-politics
Schneider’s defense is laughably child-like. If you can’t win on the merits of your arguments and policy positions and stoop to this kind of trickery, you are circumventing the Democratic process. Period. Whether it’s the Democrats or Republicans, whoever does this shouldn’t be governing.
End partisan redistricting.
Great article, Bruce! Clearly explained. This symmetry measure is what AutoRedistrict uses for its anti-partisan-gerrymandering criteria, with one difference: it uses the absolute difference, rather than squared difference.
A while back I wrote a blog comparing proposed methods for measuring gerrymandering. ( I wanted to make clear how the software measure gerrymandering and why that method was chosen.) This symmetry approach was the hands-down winner. (Except I didn’t square.)
http://autoredistrict.org/news.php#measure
Since then I came up with a new idea, based on the probability of a tie vote representing how much “speech” a voter gets, and then using this to argue a violation of first amendment rights, whether discriminatory (different amount of speech for different beliefs) or general (stealing speech from voters and giving it to map drawers).
Excellent. Clear. Unbiased. The fact that the census occurred on a non-presidential voting year enabled Republicans (who planned very openly for this) to take maximum advantage. Since then they have acted radically (not conservatively), removing multitudes of longstanding Wisconsin law and policy never before considered partisan, without any kind of careful foresight. Now only the courts (also firmly partisan now) have any potential to re-instate Democracy in Wisconsin, but of course, the damage has been done regardless of any redressive decision. Making irreversible anti democratic changes at the behest of wealthy donors (Kochs and others closer to home) smacks of oligarchy. Excellent explanation of difficult statistical concepts Bruce!