
The Shrinking Labor Force
The percent working has dropped in U.S. and even faster in Wisconsin. Why?
Since the Great Recession hit, the unemployment rate has gone down both nationally and in Wisconsin as jobs have been added. However, the labor force participation rate has not acted the way it usually does during an economic recovery. Rather than participation growing as discouraged workers reenter the job market, it has been shrinking nationally and in Wisconsin. That’s a problem.
The Civilian Labor Force is defined as the sum of civilian employment and civilian unemployment. The people counted are civilians (not members of the Armed Services) aged 16 years or older, who are not in institutions such as prisons, mental hospitals, or nursing homes. Among the people not counted are full-time students, retirees, stay-at-home spouses, and those who have given up looking for a job.
Here is a chart showing the reason people give for why they are not part of the work force, based on calculations by the Atlanta Federal Reserve using data from the US Bureau of Labor Statistics. At the bottom of the bar chart are people who would like a job but not actively looking—the so-called “discouraged workers” who may have concluded that no jobs are available so there’s no point in looking. These people are typically not included when computing the unemployment rate.
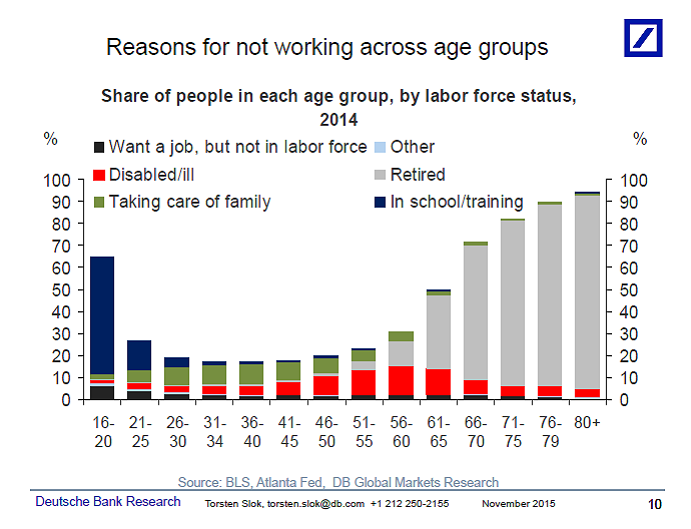
Reasons for not working across age groups
Shown in red are people who are ill or disabled. Their numbers peak just below age 60. One area of controversy is how much the growth of this population reflects weaknesses in the job market: could they do a job if one were available that was less physically demanding?
People who work part-time are counted as part of the work force. As a result the chart underestimates the number of students, stay-at-home parents, and retirees.
For the U.S. as a whole, the labor force participation rate peaked around the year 2000, well before the Great Recession, and has been declining ever since. That decline is tracked by the following chart from the St. Louis Fed based on projections from the Bureau of Labor Statistics (BLS). The BLS has had to repeatedly re-estimate its projections of future labor reports since 2002 because of the unanticipated decline in participation.
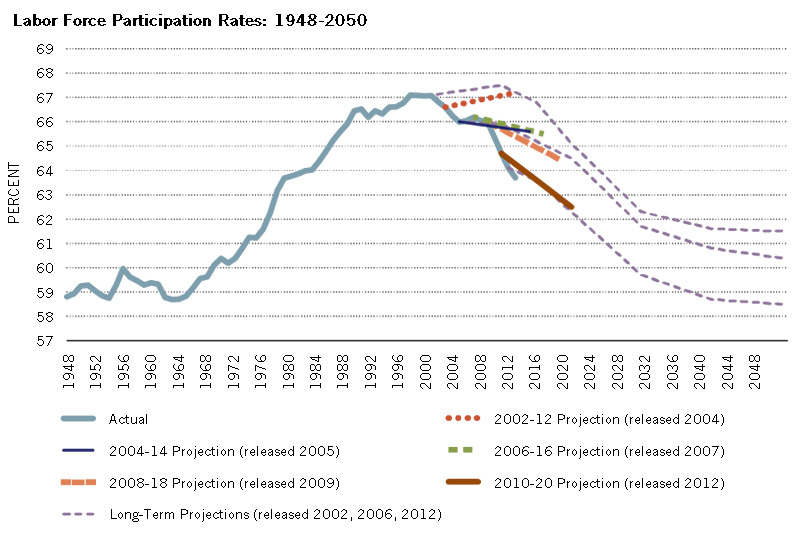
Labor Force Participation Rates: 1948-2050
Why is the labor force participation rate going down? A major cause is demographics. Even in 2002 the BLS expected the rate to start declining—but not as quickly as actually happened.
The following chart shows why a decline was expected. It shows the birth rate since 1910. The US birth rate hit bottom in the 1930s with the Great Depression. With post-war prosperity it peaked again in the 1950s only to hit a new low in the early 1970s. There was a slight uptick around 1990 (sometime attributed to the “baby boom echo”). Since then, the birth rate has resumed its decline.
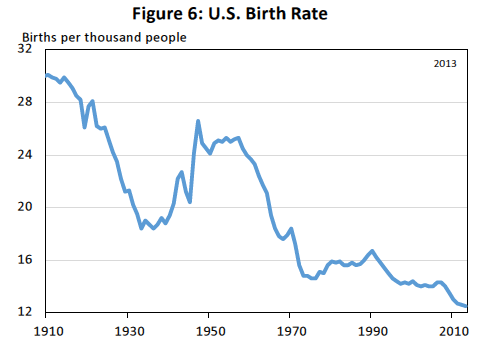
U.S. Birth Rate
As the result much of the decline was anticipated, as the baby boom generation retired, to be replaced by smaller cohorts.
At least since 1948, when counts were first made, the participation rate of men has been continually declining, as shown in the next graph. Despite this, the overall participation rate increased during much of this period as more women entered the workforce. What’s notable about the decline in participation since 2000 is that it’s due much more to women leaving the labor force than any major change in the behavior of men.
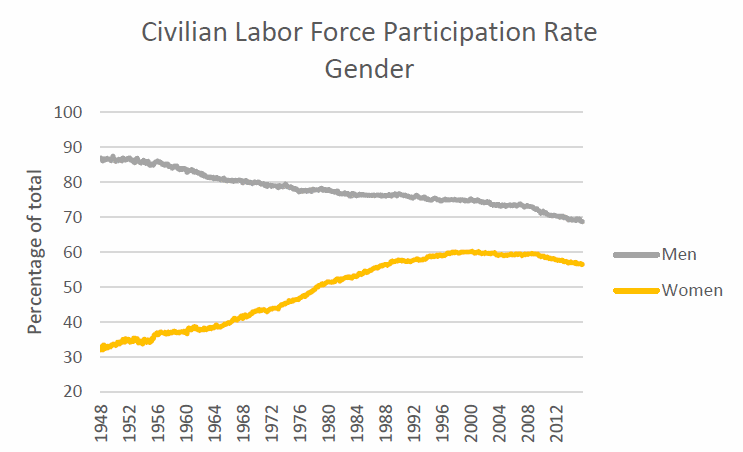
Civilian Labor Force Participation Rate
The shift downward for women’s participation is not been seen in most other advanced economies, as illustrated in the next graph. This is somewhat surprising since the American economy has recovered better than others from the Great Recession. One possible explanation is the lack of a family leave policy in the U.S., making it harder for parents, especially women, to balance a job and child-raising, than in other advanced economies.
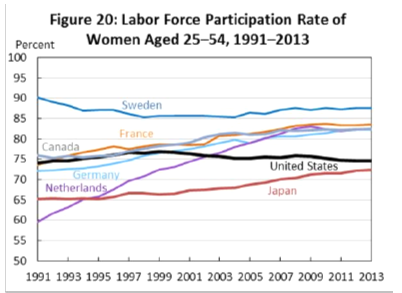
Labor Force Participation Rate of Women Aged 25-34, 1991-2013
The decline in the labor force participation rate has been particularly notable among younger Americans. By comparison, as the next graph shows, until recently the rate has been rising among those over age 55. As with many other economic indicators, possible causes could reflect either positive or negative trends. The decline in participation by those in their early twenties, for instance, could reflect a tougher job market, a desire for more education, or a combination of both.
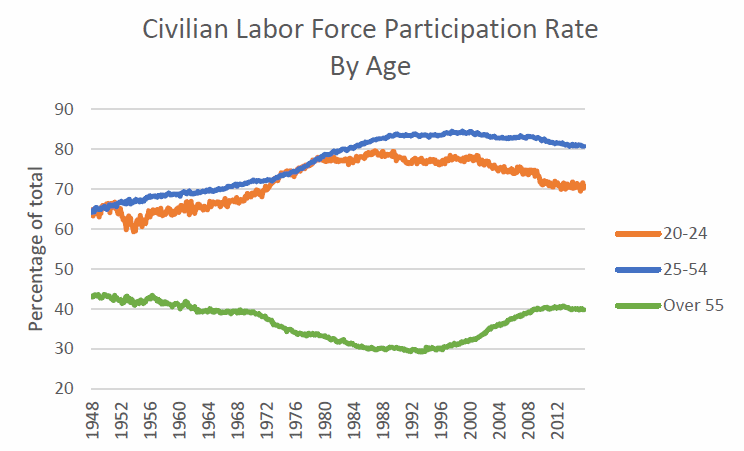
Civilian Labor Force Participation Rate By Age
The increased participation rate among older workers is even more notable if only those 65 and older are measured. As the next chart shows it has been steadily rising since 2008 when the recession hit bottom. Again, possible explanations encompass the optimistic (increased health and vigor among older Americans) to the pessimistic (inadequate retirement funds).
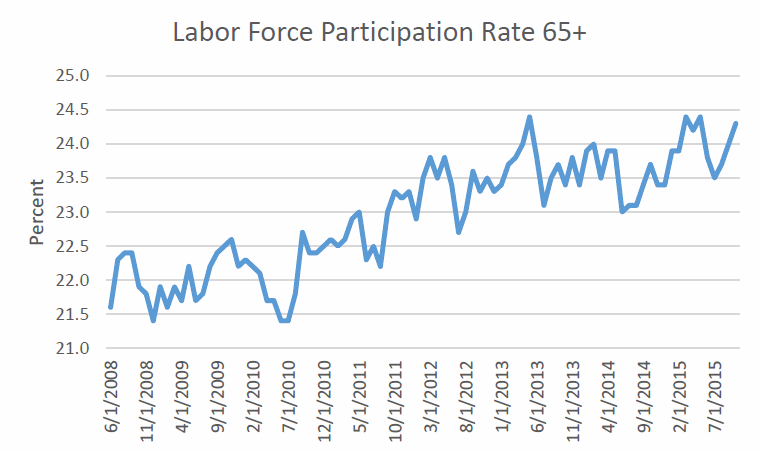
Labor Force Participation Rate 65+
The next graph, from an analysis by the US Council of Economic Advisers (CEA), charts the decline in the labor force participation rate since 2009 that would be explained by demographics (“aging trends”) and the Great Recession (“cyclical effects”). It turns out that these two effects are sufficient to explain about two-thirds of the decline; the remaining third of the decline (called “residual”) is harder to explain.
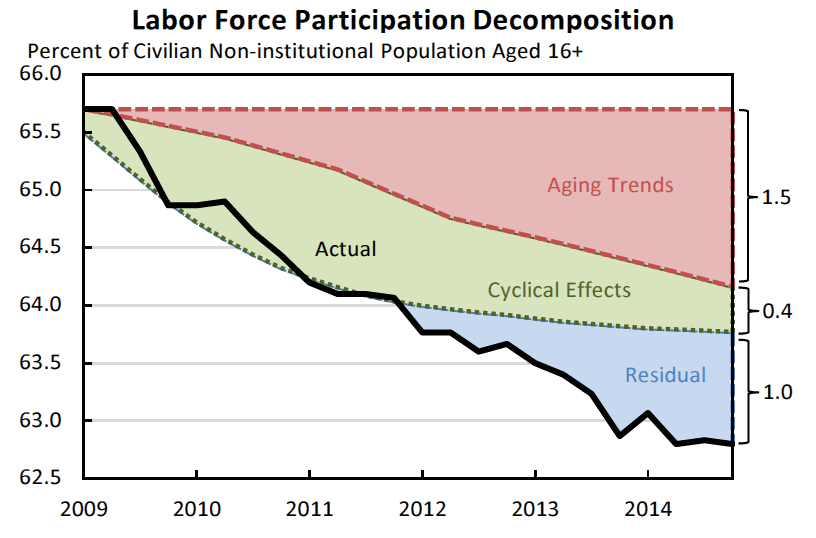
Labor Force Participation Decomposition
The CEA also finds that American work force participation rates are lower than in most other advanced countries (members of the OECD) for both men and women. Again, this is surprising because the U.S. has recovered faster from the recession than most Europe countries. In addition, most European countries are challenged by a workforce older than that in the U.S.
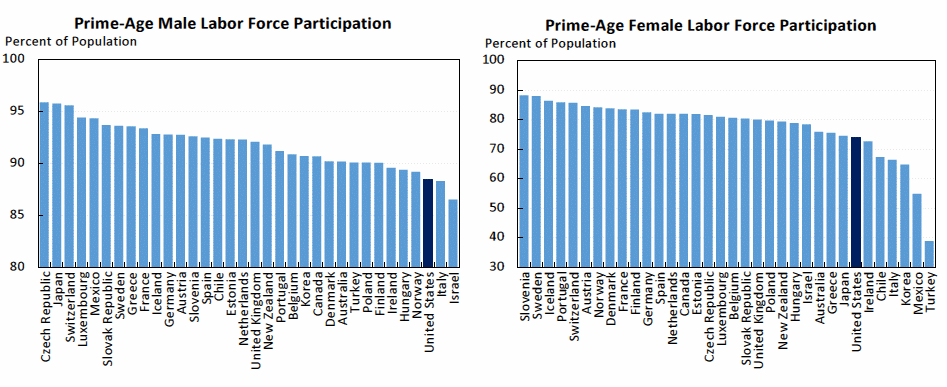
Prime-Age Labor Force Participation
The CEA report makes four recommendations: immigration reform to address the aging workforce, adopting family-friendly workplace policies that make it easier for women to participate, aggressively pursuing steps to reverse the declining participation of men—particularly minority men, and addressing long-term unemployment.
If the labor force presents mysteries nationally, those mysteries deepen when Wisconsin is considered. Even though the rate of workforce participation has declined in the US, in raw numbers it has grown since the recession. The same is true of Wisconsin’s neighbor Minnesota, as shown on the next chart. Yet Wisconsin’s work force — the total number of civilian workers — has been essentially flat since 2010. Why didn’t the labor force increase with the recovery?

Civilian Labor Force (thousands)
As one would expect in an economic recovery, the number of discouraged workers has been steadily declining since the recession’s peak. In fact, the unemployment rate that includes discouraged workers, called “U4,” has dropped by 50 percent since 2010 in Wisconsin, Minnesota, and nationally. One possible explanation is outward migration–that people looking for jobs have found the grass greener in other states. Somewhat contradictorily, one hears numerous complaints from Wisconsin employers that they cannot find qualified employees.
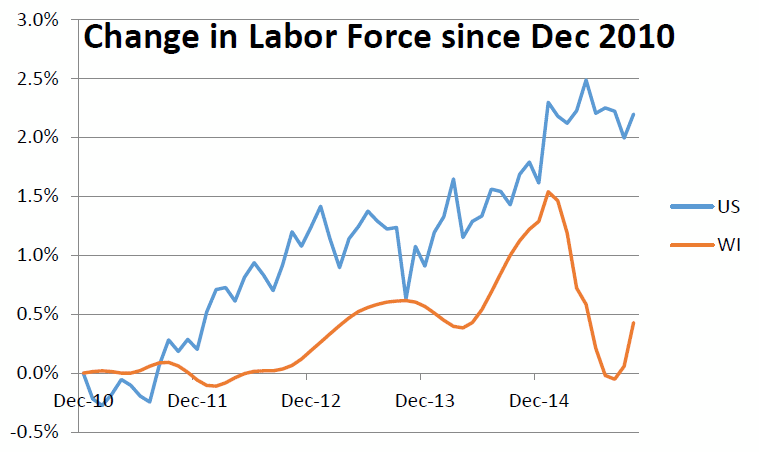
Change in Labor Force Since Dec 2010
The behavior of the labor force size offers far more questions than answers, both in Wisconsin and the U.S. as a whole. Oddly, economists at the Wisconsin Department of Workforce Development seem unconcerned: they stopped issuing reports on this after 2013.
Here are a few possible partial explanations:
- The very success of the private economy in forcing down the cost of production of many goods has resulted in less need for employees in sectors like manufacturing.
- At the same time, increasing political opposition to government has meant that government hasn’t picked up the slack by, say, investing in infrastructure or other public services.
- Greater income inequality has held down total demand for goods and services. Low-income people who need those goods and services don’t have the funds to purchases them while there is a limit on what those on at the top of the income ladder can productively purchase.
- The needs-based qualifications for many transfer programs may discourage participation in the labor force, in effect placing a high marginal tax on working. For example, particularly in states that did not expand Medicaid, working at a low-pay job may result in the loss of health care. This may help explain why European countries have not seen the same decline in labor participation as the U.S. It could also help explain why people over 65 are the only group increasing participation in America; neither social security nor Medicare place a heavy tax on working.
All of which raises important questions. Unfortunately the search for real answers is likely to be lost in the effort to make political points.
Data Wonk
-
Who Do You Trust to Conduct Elections Fairly?
 Apr 6th, 2026 by Bruce Thompson
-
Is Non-Citizen Voting a Real Threat to Elections in Wisconsin?
Mar 18th, 2026 by Bruce Thompson
-
How Global Climate Change Affects Milwaukee
 Mar 11th, 2026 by Bruce Thompson


Older work froce and no jobs for our youth despite great college system. All five of my kids are gone to work elsewhere.
I’ve only had a chance to look through this article briefly. I appreciate your work Bruce, but you have to stop with adding a homage to right-wing thinking, as a way to seem balanced. I bring up your speculation about “needs-based qualifications for many transfer programs may discourage participation in the labor force”.
This is old right-wing spin that, like all the others, falls down in the face of evidence. Basically, you’re talking about human nature and that people will do less when they have a little more than subsistence… the evidence doesn’t bare that out.
http://ftp.iza.org/dp6959.pdf
“The overall results indicate that the programs have not introduced any substantial disincentives to work and that they have had no significant effect on the intensive or the extensive margin of labor supply for individuals or households in treatment localities.”
Otherwise, it looks like a good start.
“We are all born ignorant, but one must work hard to remain stupid.” – Benjamin Franklin
I think one potential explanation is simply the lower quality of the jobs themselves. This is hinted at in the point about family leave policies being lousier compared to just about everywhere else. That is just one of the problems with a lot of the average-to-lower-end jobs out there these days. They pay less and expect more. You have to contribute more toward your insurance, which is often subpar insurance anyway. You have less sick time. You’re expected to work odd hours and on holidays, often without the incentives. Raises are harder to come by. And so on. Not to mention some of the tactics used at many retail and service jobs, like having to be “on call” for your $9/hr job, not having a set weekly schedule, being kept at the maximum of part-time so as to not qualify for full-time benefits, etc.
These types of practices by employers, trying to keep labor costs as low as possible, lead a lot of people to say, “Is this really worth it for the extra income it brings to the family?” In the case of many married women, as well as other people whose incomes are supplemental rather than primary, I think there are more saying, “no, this isn’t worth it.” Going through the recession forced a lot of people to tighten their belts and do things like share cars, move in with relatives, and cut back on spending. At the same time, it also afforded some people greater time spent with their children or their parents and greater free time even though money might be tighter. So there are a lot of folks who, I think, are part of that “residual” portion of the graph who have weighed the costs and benefits of their situations and have decided not to participate in the labor force. They look at the jobs available to them and the down sides of those jobs, and they think, it’s not worth the hassle to work a crappy job to marginally increase income. At a certain point, their quality of life is improved by having more time with their loved ones and less stress, even if it means less money.
Following WWII, most competition in the world market had been wiped out and the USA held a 60% of the planet’s GDP and was a great producer nation of products. The WWII generation and their baby boomers rode this crest of great jobs with a peak purchasing power achieved in 1969 and in decline ever since. Starting in the 1970s, and into the 80s, a dramatic erosion of production jobs moved out of the country. Tax policies in the 80s supported this corporate behavior. The 2007-08 crash further eroded millions of production jobs in the nation and thousands in WI with closures of two car plants and at least four paper mills. Today the USA holds 17% of the planet’s GDP with 4% of the population and in decline while China is at 17% and rising. GM sells more cars in China with a larger middle class than the USA, and wants to sell Chinese GM imports in the USA.
WI leads the nation in loss of family income since 2000, and in working age people leaving the state. Act 10 polices eroded 15% of public worker wages and along with it another 50,000 jobs in small business. People have less money to spend, and it harms small business the most.
Large corporations getting bought up further consolidate, lay off workers, shutter more plants, and off shore more production. It is a vicious downward spiral of contraction with no end in sight. There are no easy solutions. There are many small ones including tax incentive policies that could start a shift to quality of jobs and appreciation of the workers again.
We all know family and friends that are suffering and in despair struggling financially. Many have higher education but Walmart as the largest employer in the nation, and other service sector jobs are not even close to being an equivalent quality job compared to the production positions that have been lost.