How Much Did New State Legislative Districts Change?
Much closer results, far less gerrymandered despite increasing polarization.
The November 2024 election represented the first application of new Wisconsin Senate and Assembly district maps aimed at reforming the previous extreme gerrymander favoring Republicans. The Wisconsin Elections Commission has recently released the official results of the votes for these districts.
A model widely used to predict future election results is included on a website called Dave’s Redistricting or DRA. Redistricting involves moving wards around to form new legislative districts. It is assumed that the newly moved wards carry along their partisan voting preferences and other characteristics. In estimating the likely partisan vote for each proposed electoral map, the DRA website used voting results from six previous statewide elections: President in 2016 and 2020, U.S. Senator in 2018 and 2022, Governor in 2022, and Attorney General in 2022.
Wisconsin Assembly
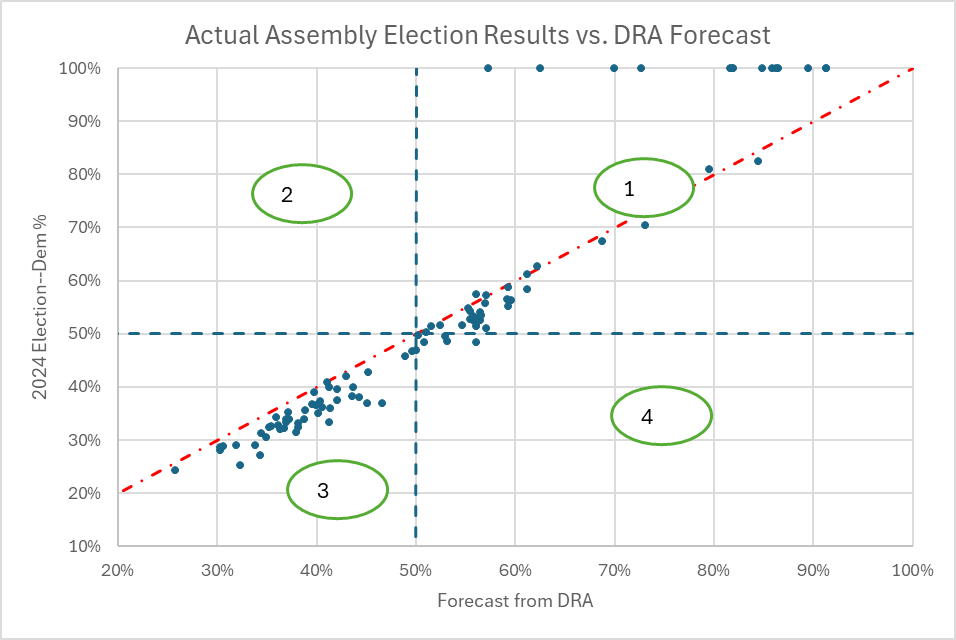
The next graph compares the results predicted by DRA to the actual vote in all 99 Wisconsin Assembly districts. Each dot represents one district. The horizontal dashed line shows the percentage of all votes that would go to the Democrat. For example, the first dot in the lower left-hand corner represents Assembly District 59 in which the Democratic candidate was predicted to receive 25.75% of the vote.
The vertical axis shows the percentage of votes actually won by the Democrat in the November election. Thus, the same Democrat actually received 24.22% of the vote, a bit less than predicted.
The vertical dashed line separates winners from losers in the DRA forecast. A district to the left of that line meant that the Republican candidate was likely to win; districts to the right of the line were projected to host a Democratic victory.
The horizontal dashed line separates winners from losers in the actual election. Above that line, the Democrat won. Below, the Republican won.
Together the vertical and horizontal dashed lines separate the graph into four quadrants. Thus, in quadrant 1 districts, the Democratic candidate was both predicted to win and did indeed win. Similarly, quadrant 3 districts were both predicted to elect the Republican and did so. Quadrant 4 districts were predicted to vote Democratic but voted Republican. If a district was predicted to go Republican but instead went Democratic, it would fall in quadrant 2.
In addition, quadrant 3 districts not only chose the Republican candidate, they did so by further squeezing the Democratic candidate. In the graph, this is shown by their consistent position below the red dashed line.
The most likely explanation for this effect is that Republican districts have become more Republican in the last few years. The DRA forecasts were developed using the results of six previous state-wide elections taken over the previous eight years. Evidently as a result, the forecast underestimated the increasing partisanship of these already highly partisan districts.
Wisconsin Senate
In contrast to members of the Assembly, Wisconsin Senators serve for four-year terms. Sixteen of the 33 Senators are elected in presidential years and have even-numbered districts. The other 17 Senators are elected in off years and serve in odd-numbered districts.
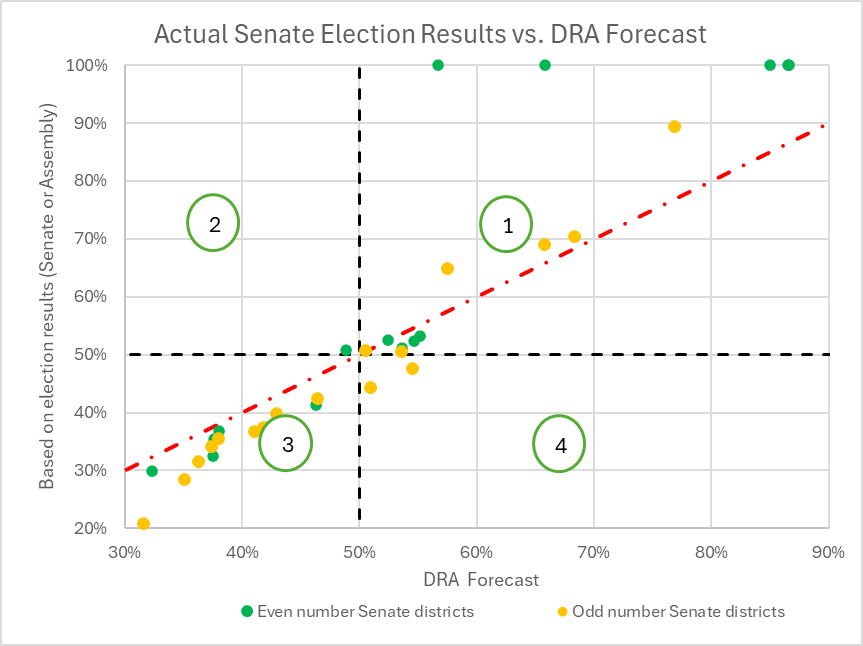
The next graph summarizes the situation in the state Senate following the November election. Each dot represents a Wisconsin Senate district. As with the chart for the Assembly outcome, the horizontal axis shows the pre-election forecasts from DRA. The vertical axis shows the result of the actual election.
In the chart below, the sixteen Senators who were elected in November are represented by green dots. In five of those districts, Republicans did not field a candidate.
The 17 districts with odd-numbers and scheduled for the 2026 election are shown with yellow dots. These were approximated by adding the election results for each of the three Assembly seats contained within each Senate District.
I divided the results into four quadrants depending on the district’s performance in the DRA forecasts and in the voting.
In quadrant 1, Democrats win both the forecast and the actual election. In quadrant 3, Republicans win both. In quadrant 2, the Democrat wins the election, despite losing in the forecast. In quadrant 4, Republican win the election despite losing the forecast.
The red diagonal line distinguishes the difference between performance on the forecast and election results. Above that line, Democrats would have done better in the election than predicted by the DRA’s model (and Republican worse).
Note that voting for Senate shows the same pattern as for members of the Assembly: in the heavily Republican districts in quadrant 3, the Democrat share of the vote decreased between the forecast and the actual election.
In recent years, Wisconsin has become increasingly polarized politically. The November election confirms this trend, at least among the state’s Republicans.
If you think stories like this are important, become a member of Urban Milwaukee and help support real, independent journalism. Plus you get some cool added benefits.
Data Wonk
-
Life Expectancy in Wisconsin vs. Other States
 Dec 10th, 2025 by Bruce Thompson
-
How Republicans Opened the Door To Redistricting
 Nov 26th, 2025 by Bruce Thompson
-
The Connection Between Life Expectancy, Poverty and Partisanship
 Nov 21st, 2025 by Bruce Thompson


