How Fair Are Wisconsin’s Taxes?
And how will they be affected by Trump tax cuts?
In his “Cross of Gold” speech to the 1896 Democratic National Convention, William Jennings Bryan argued that:
There are two ideas of government. There are those who believe that if you will only legislate to make the well-to-do prosperous their prosperity will leak through on those below. The Democratic idea, however, has been that if you legislate to make the masses prosperous their prosperity will find its way up through every class which rests upon them.
Early reports from the incoming Trump administration suggest that its tax agenda will be motivated by Bryan’s first “idea of government,” the one he opposed. The secret to prosperity, according to its advocates, is to reduce taxes on the wealthy whose gains will trickle down or “leak through” on the rest of us, as Bryan put it.
The yellow line in the graph below shows the historical behavior of the Gini for the United States. Between 1963 and 1980, the Gini declined, indicating that US economic inequality was shrinking. Around 1980, the index reversed direction and started rising, indicating the growth of inequality.
This contrasts with Canada, shown in purple. In 1971, Canada’s Gini index was essentially the same as the United States’ (36.9 for the United States versus 37.2 for Canada). However, while the United States’ index rose, reflecting increased inequality, Canada’s declined, reflecting less inequality. By 2019, the US index was almost ten points higher than Canada’s (41.5 versus 31.7). (These values were developed by the World Bank using household survey data obtained from government statistical agencies and World Bank country departments.)
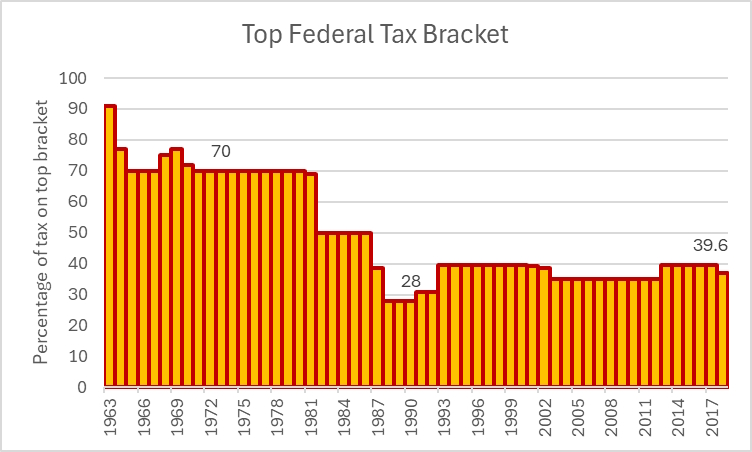
What accounts for the increased American economic inequality? One likely factor was the sharp reduction in the tax on the top bracket of income starting in 1981, shown in the graph below. This reflected the stated belief of many members of the Reagan administration that lower taxes on wealthy individuals and corporations would make for more prosperity.
There are three main sources of revenue for units of government, whether federal, state, or local: sales taxes, property taxes, and income taxes. If a tax takes a larger percentage of wealthy people’s income than of low-income people’s, it is classified as progressive. If instead, low-income people pay a higher percentage of income, the tax is regressive. If the percentages are the same across income, the tax is a flat tax.
For residents of Florida, the percentage of income devoted to taxes steadily decreases as income goes up. People in the lowest quintile pay 13.2% of income on average, compared 2.7% for the top one percent.
In Minnesota, those in the lowest quintile pay 6.2% of income. This rises to 10.5% for the top one percent. By contrast, our state’s tax system is regressive but not nearly as much as Florida’s: Wisconsin residents in the lowest quintile pay 10.8% of income while those in the top one percent pay 6.6% of income.
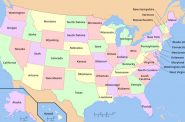
The next graph plots states’ Tax Inequality Index rating on the horizontal axis against their vote in the recent presidential election on the vertical. Only six states have progressive tax systems. The vast majority have regressive taxes, reflecting heavy dependence on sales taxes. To a certain extent the regressiveness of state taxes is counteracted by progressive federal income taxes.
Although the connection between progressive taxes and voting is a weak one, it is notable that all six state with progressive taxes voted for the Democratic candidate. This group of states may leave the impression that Democratic states are more likely to have progressive tax systems than states that favor Republicans. Yet the runner-up for most regressive state tax is Washington, as safe a Democratic state as any, but with no income tax.
Because of something called the Byrd Rule, tax reductions in the Tax Cuts and Jobs Act of 2017 were written to expire after ten years. Doing so allowed the act to pass the Senate with only a majority vote, avoiding the filibuster. The incoming Trump administration intends to extend the currently scheduled reductions. Doing so would make the overall American tax system more regressive.
One reason is that the TCJA is itself regressive, as can be seen in this distributional reduction in taxes by income. In addition, it has the effect of reducing income taxes and shifting the importance of more regressive taxes.
The Trump approach will make taxes in Wisconsin and 43 other states even more regressive, and less progressive in the 6 states that have a progressive system of taxes. While this will reduce the taxes of Donald Trump and the billionaires who backed his election, it will be costly for the rest of us, unless their increased prosperity will somehow “leak through on those below.”
If you think stories like this are important, become a member of Urban Milwaukee and help support real, independent journalism. Plus you get some cool added benefits.
Data Wonk
-
Life Expectancy in Wisconsin vs. Other States
 Dec 10th, 2025 by Bruce Thompson
-
How Republicans Opened the Door To Redistricting
 Nov 26th, 2025 by Bruce Thompson
-
The Connection Between Life Expectancy, Poverty and Partisanship
 Nov 21st, 2025 by Bruce Thompson


“While this will reduce the taxes of Donald Trump and the billionaires who backed his election, it will be costly for the rest of us, unless their increased prosperity will somehow “leak through on those below.” ”
Well, we know that won’t happen. Republicans make this promise over and over, but all the data on it, shows that it is a lie.
One of the most ridiculous articles I have ever read. If this were true, states like New York and California would be doing great. Most studies show that in reality the more money a state spends on government the worse the services, schools and outcomes are. You can not tax and spend your way out of problems. Illinois to our South is the perfect example of this failed ideology.
Once upon a time, (and more than 40 years ago) I think it was called something like trickle down economics. Some say that trickle-down economics has been proven false, and that it has widened the wealth gap between the rich and poor. Others say that the mixed results of tax cuts on unemployment do not support the idea that tax cuts for the rich will lead to job growth.
In other words…bend over…the taxpayers are going to take it where the sun don’t shine.
Perhaps Brother Cotic could provide a few references to these “most studies show”? When Agent Orange lies,he usually prefaces it with “people say” or “studies show”…..
What happened to President Eisenhower?
Where are our federal tax dollars going?
Look at the recent hurricane on the East Coast. The active Army is setting at Fort Bragg, and states call out the National Guard. Great, the active Army paid every day. Tear the National Guard away from their civilian jobs, and there is a cost – federal dollars to pay their military salaries. After a few weeks, the President authorizes a few thousand Soldiers to help.
How big a military do we need? We keep increasing the pay? Generals receive full pay on retirement – why is that a good idea?
Look at the PACT – the law to provide care for Vets who were exposed to toxic burn pit smoke. More scholarships for doctors? Require 10% of those going to the US Military Academy to continue on to medical school? Allow – or require the US military to help provide coverage at Veterians’ Hospitals? None of that. . . .
What the law did was increase the amount that the Veterans’ Hospital can pay doctors. So, the doctor that was seeing medicare patients is now getting paid more working for the Veterans’ and grandmother doesn’t have a doctor to see.
What is important – increasing the number of US Engineers – and how are we doing? Is there a special program to pay for Engineering School (or medical school)?
Interest is a scary thing. I want to think that my tax dollars are being used for something positive – not paying interest.
The President doesn’t make the law – Congress does – WHY AREN’T WE TALKING ABOUT REPRESENTATIVES? Why aren’t we holding them accountable? Representative Fitzgerald? How did he vote?
Who is actually responsible?