
Which Party Is Better For The Economy?
Data shows a clear difference going back a century, including Biden and Trump.
Joe Biden and Donald Trump.
Three recent Marquette Law Polls asked Wisconsin respondents whether they believed that Joe Biden or Donald Trump would do a better job handling the economy, or whether they considered both about the same or that neither would be good. Overall, 51% of the respondents chose Trump over 33% for Biden as better for the economy.
The next graph shows the percentages of each choice by the respondents’ political affiliation. While 93% of Republicans choose Trump as better for the economy, fewer Democrats (71%) say Biden is better. Also, independents chose Trump over Biden. (These data include all self-identified independents, including those who said they usually preferred one party over the other.)

Would Biden or Trump do a better job handling the economy?
Is the respondents’ preference for Trump’s administration of the economy over Biden’s supported by historical evidence? Any analysis comparing economic data from Trump’s previous administration versus Biden’s current term is complicated by the emergence of COVID-19 in 2020, Trump’s final year in office. Certainly, Trump cannot be held responsible for the pandemic’s impact, which caused the shutdown of much of the economy.
However, it is fair to criticize him for his administration’s chaotic response and his willingness to promote unproven remedies. Biden inherited the pandemic and applied needed discipline to the response.In April 2022, the Marquette poll asked which party, as opposed to which candidate, would be better at creating jobs. The result was a virtual tie, with 46% choosing the Democratic party and 44% the Republican, mostly voting along party lines, as shown by the next graph.
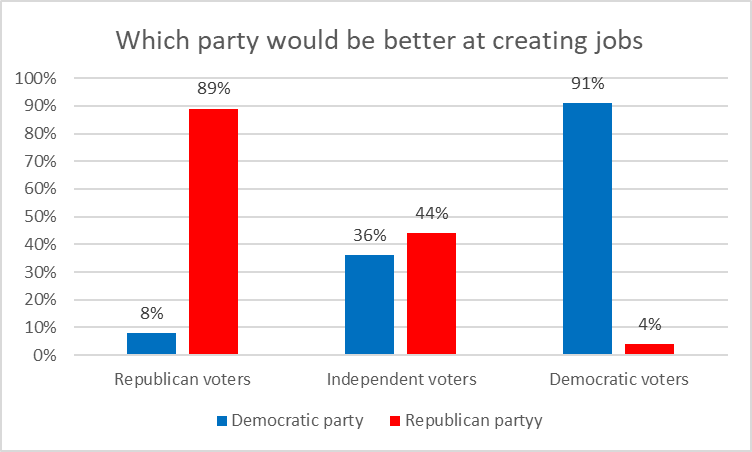
Which party would be better at creating jobs?
The next graph shows the annual percentage change in US jobs starting with the Truman administration by the party of the president. I calculated the percentage increase in jobs during each president’s term and divided that by the number of years in office.
As a rule, the blue columns are longer than the red lines, suggesting that jobs have grown more with Democratic presidents than with Republican ones. In fact, average annual job growth was 0.9% during Republican presidential years, compared to 2.8% with Democratic presidents, three times greater.
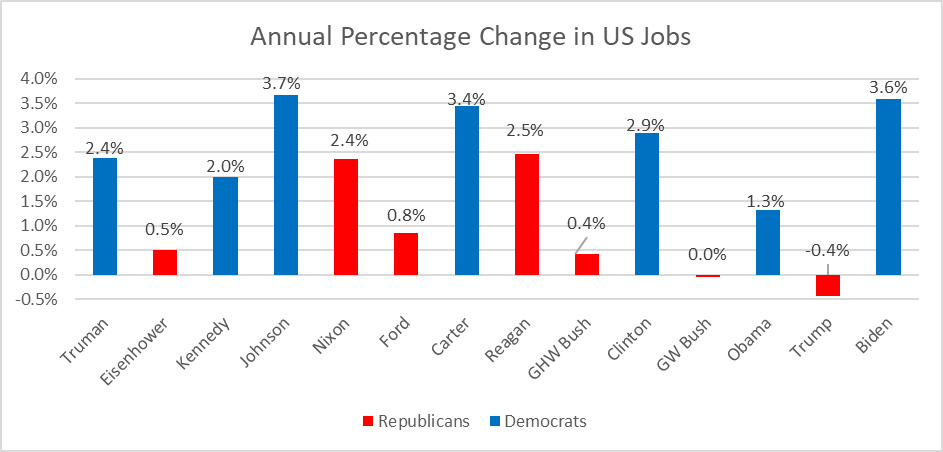
Annual Percentage Change in US Jobs
The annual growth in Wisconsin jobs tells the same story, as shown in the next graph. On average Wisconsin jobs increased by 0.3% under Republican presidents, compared to 1.6% under Democrats. (These and other economic data used in this column come from the U.S. Bureau of Labor Statistics as reported on the St. Louis Federal Bank’s FRED database. The Wisconsin job series starts January 1, 1990.)
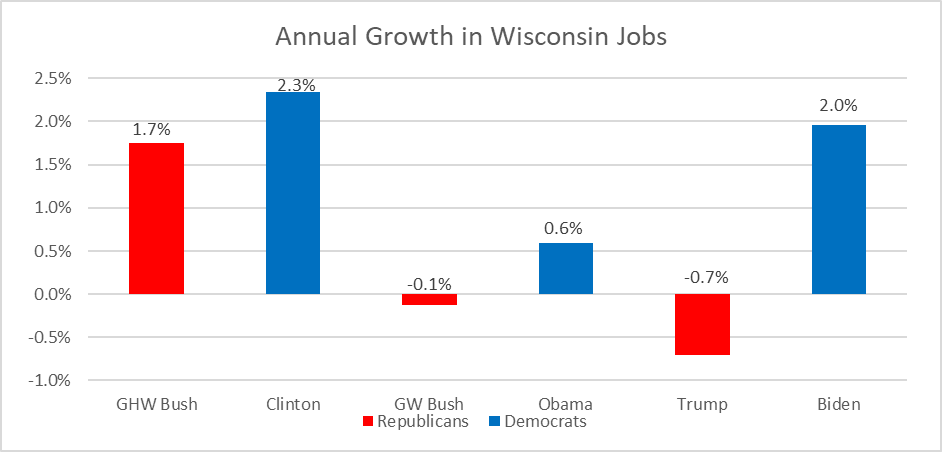
Annual Growth in Wisconsin Jobs
The unemployment rate tells the same story. The next graph shows the change during each president’s term in office. Downward facing columns show that the unemployment rate went down. Strikingly, only one Republican president—Ronald Reagan–presided over a decrease in unemployment, compared to 6 Democrats.

Change in Percentage US Unemployment
Wisconsin unemployment rates are shown in the next graph. Notably, unemployment during the Carter administration, which was essentially unchanged nationally, increased substantially in Wisconsin. But recall that the late 70s and early 80s were tough years for Wisconsin. Several large Wisconsin businesses, notably Schlitz and Allis-Chambers, ceased operations during that period.
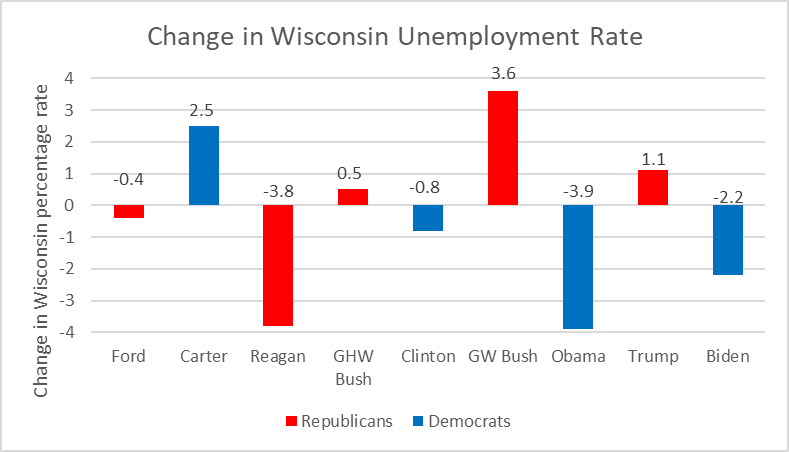
Change in Wisconsin Unemployment Rate
Over the years, there have been a substantial number of studies that found the nation did better economically with Democratic presidents than with Republicans. Wikipedia does a good job of summarizing the studies and what they found. Starting around the new century a growing number of studies found that the economy was notably better with Democratic presidents than Republicans.
When that pattern was first noticed is unclear. A 2016 opinion piece in Forbes reports that Donald Trump told Wolf Blitzer in 2004: “I’ve been around for a long time and it just seems that the economy does better under the Democrats than the Republicans.” (Perhaps unsurprisingly, clicking on the link that this column references leads to a message that “This video is no longer available because the YouTube account associated with this video has been terminated.”)For years, however, this pattern was ignored by economists and political scientists. The results of the Marquette poll confirm that the myth of Republican economic superiority is still widely believed.
Finally, in 2016, two Princeton economists gave the widely observed phenomenon academic credibility. In a paper published in the American Economic Review, Alan Blinder and Mark Watson wrote that:
The US economy has performed better when the president of the United States is a Democrat rather than a Republican, almost regardless of how one measures performance. For many measures, including real GDP growth (our focus), the performance gap is large and significant.
However, they then go on to undermine the significance of their conclusion:
This paper asks why. The answer is not found in technical time series matters nor in systematically more expansionary monetary or fiscal policy under Democrats. Rather, it appears that the Democratic edge stems mainly from more benign oil shocks, superior total factor productivity (TFP) performance, a more favorable international environment, and perhaps more optimistic consumer expectations about the near-term future.
More recently, on Feb. 2, 2021, the New York Times’ David Leonhardt wrote that “G.D.P., jobs and other indicators have all risen faster under Democrats for nearly the past century. … the pattern is so strong and long-lasting that coincidence alone is unlikely to be the only explanation.”
This pattern continues today. A recent report from the liberal Economic Policy Institute examined the performance of the national economy since 1949 by partisan control of the presidency, using 12 different economic measures in most cases. For every one of the measures, the average favored Democratic control over Republican control of the presidency.One test of whether a correlation shows causality is whether it successfully predicts the future. The fact that the pattern continues long after it was first identified suggests that something more is behind it.
The question, then, is not whether the superiority of the economy under Democratic presidents is real, but what has caused it. Possible causes are a subject for a future Data Wonk column.
If you think stories like this are important, become a member of Urban Milwaukee and help support real, independent journalism. Plus you get some cool added benefits.
Data Wonk
-
Who Do You Trust to Conduct Elections Fairly?
 Apr 6th, 2026 by Bruce Thompson
-
Is Non-Citizen Voting a Real Threat to Elections in Wisconsin?
Mar 18th, 2026 by Bruce Thompson
-
How Global Climate Change Affects Milwaukee
 Mar 11th, 2026 by Bruce Thompson


Poll questions/responses to voters about the economy should be taken with a HUGE grain of salt. “The economy” has far too many meanings to the average voter. Many seem convinced that the economy is the price of gas, eggs, milk and ground beef, and not much more than that.
Here is a quote from a press release about the Microsoft investment in Racine from Robin Vos that confirms my earlier assertion about how many people view the economy:
“Instead, much like he’s asked us to ignore how much we pay in groceries and gas every week to credit him for what he maintains is a strong economy, President Biden is now asking us to ignore their efforts so he can take all the credit in an invite-only reelection stunt.”
Further proof of RV’s ignorance about the true state of the economy. If Biden’s economic numbers could be applied to Frump RV would be skipping in the streets like a little boy. But, because they are the result of a Democrat’s fulfillment of promises made they are just a reelection stunt.