Should Wisconsin End Its Income Tax?
Five conservative groups pushing this. Its impact is astonishingly regressive.

100 Dollar Bill. Photo by Dave Reid.
Should the Wisconsin income tax be abolished? A group of right-wing lobbying organizations think so.
Calling themselves the “Tax Reform Coalition,” the National Taxpayers Union, the Institute for Reforming Government, Wisconsin Manufacturers and Commerce, Americans for Prosperity, and Americans for Tax Reform have all enthusiastically endorsed a proposal to end the income tax and raise Wisconsin’s sales tax from 5% to 8%.
The proposal comes at a particular time in U.S. history: Over the past decades, economists have tracked changes in economic inequality in the nation. Although the models, measurements, and details differ widely, they all reach the same conclusion: inequality has grown in the US over the last 50 years, and the benefits of a growing economy have disproportionately flowed to a relatively few wealthy people.For example, the graph below, based on work from the Universities of Groningen and California at Davis, shows labor’s share of compensation (as opposed to capital) since 1950. The labor share varies considerably from year to year. However, the overall trend is downward, with the biggest drop from around 65% in 1970 to 60% in 2019. (Values for 2020 are not yet available.)

Labor Share of Compensation
The next chart shows the distribution of wealth in America among four groups of families and how the proportions have changed since 1989. The data comes from Board of Governors of the US Federal Reserve System.
The share held by the top 1%, shown in purple, has grown from 23% to 32% in that period. By contrast, the share held by the bottom half of American families barely shows up on the chart. It has shrunk from 3.7% to 2.5%.
The upper middle class, those making more than the average income but below the top 10%, have also seen a shrinkage in their share of wealth—from 35% to 28%. At around 37%, families in the top 10% but below the top 1% have maintained the same share of wealth.
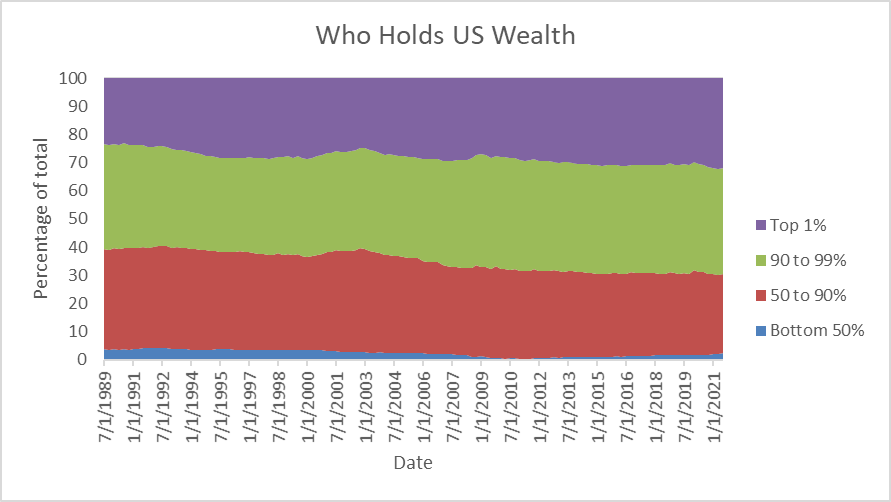
Who Holds US Wealth
The Gini index is a commonly used measure of economic inequality. By its design, a society in which all income went to a single family, would have a Gini index of one. If all families had the same income, the index would be zero.
As the chart below shows, inequality, as measured by the Gini and calculated by the US Census Bureau, hit a minimum during the 1960s. Since then, inequality has shot upward, although the trend line might suggest a recent leveling out.
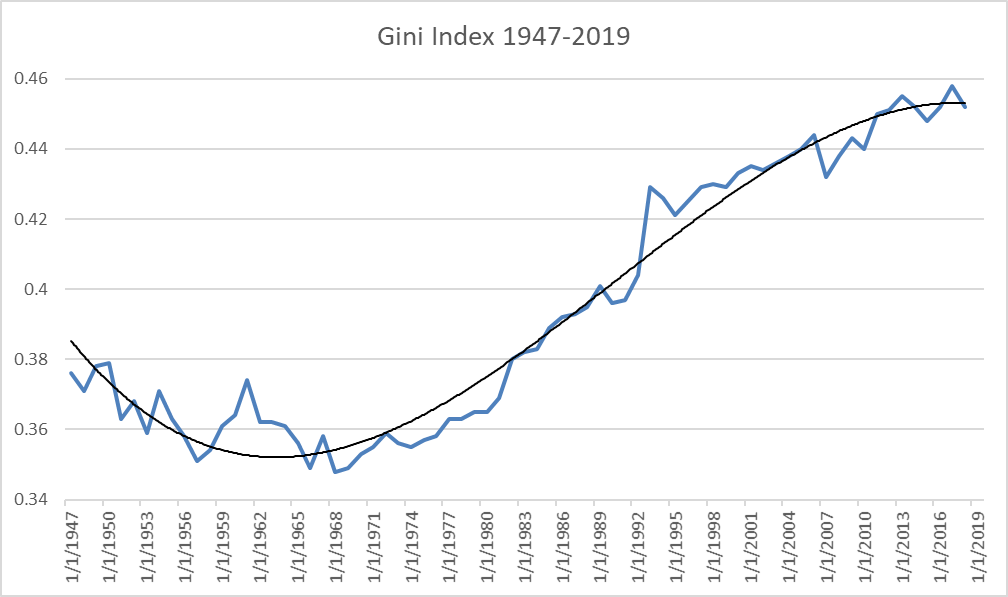
Gini Index 1947-2019
While some people find the increasing concentration of wealth a threat to democracy, others are pushing for government policies that would encourage its growth. Among these are the five organizations mentioned at the beginning of this column. In a press release from December of last year, they push a paper from Noah Williams, the director of the Center for Research on the Wisconsin Economy (CROWE) at UW-Madison.
In his paper, Williams proposes the elimination of Wisconsin’s income tax and its partial replacement by increasing the state’s sales tax from the current 5% to 8%. For anyone concerned about increasing concentrations in wealth and income, this is moving in the wrong direction.
Most income tax systems, including Wisconsin’s, are progressive; that is, their tax rates go up as income rises.Sales taxes, by contrast, are regressive—the wealthier taxpayers are, the smaller the share of their income goes to paying the sales tax. This is because wealthier taxpayers generally use a much smaller portion of their income on purchases subject to the sales tax.
In common with previous proposals to cut taxes on wealthy people, Williams points to purported financial benefits. He argues that this “reform leads to 7.9% higher output and 6.9% higher employment in the long-run, with a long-run net tax cut of 12.6% of state tax revenue.”
His proposal is certainly a very regressive one. Calculations by the Institute on Taxation and Economic Policy (ITEP) concluded that someone in the top 1% would get a tax break of $78,122, compared to an average tax increase of $460 for those in the lowest 20%.
We have seen this movie before. Nowhere in Williams’ paper does he mention the Kansas tax experiment or of claims made for the Trump tax cuts.
Under the influence of then-governor Sam Brownback, the Kansas Legislature passed a series of laws that vastly cut taxes in the state. Like Williams, they argued that the cuts would generate radically more business activity, sufficient to generate new state revenue to make up for the lost taxes. The new laws were phased in, becoming completely effective in 2014.
Unfortunately, the promised business activity did not materialize. For instance, the next chart compares job growth in Kansas with that of its similar neighbor Nebraska.
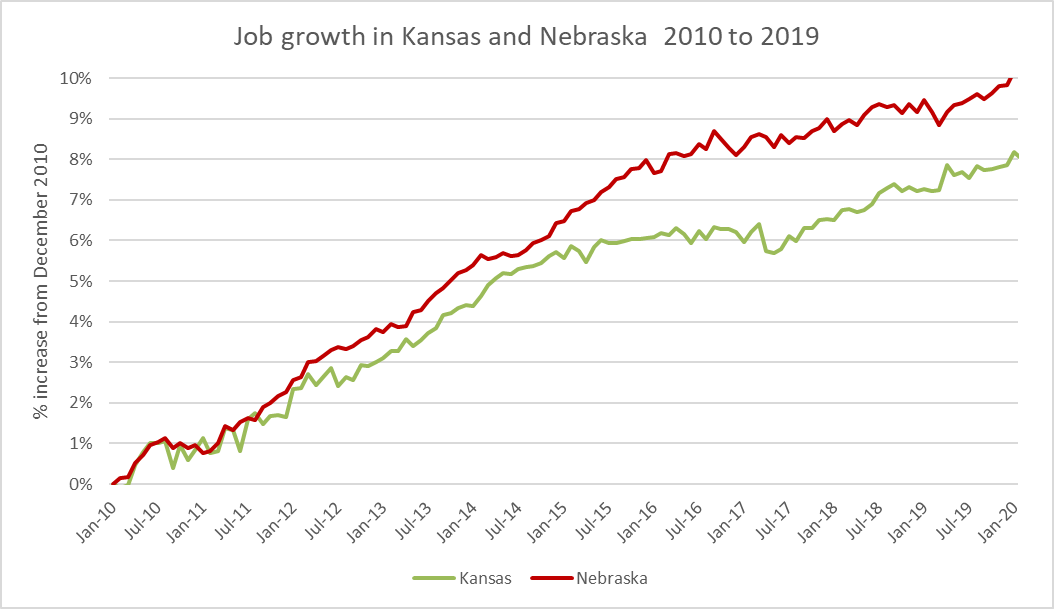
Job growth in Kansas and Nebraska 2010 to 2019
What did materialize was a financial crisis as the state was unable to satisfy its commitments. The resulting cuts in funding caused districts to shut down the school year early because they ran out of money. An article in Forbes, entitled “The great Kansas tax cut experiment crashes and burns,” lists some of the results:
Kansas had a $350 million budget shortfall in February 2017. In February 2017, S&P downgraded Kansas’ credit rating to AA−.
Gov. Brownback and his conservative Republicans paid a price as well. Running for reelection in deeply Republican Kansas, he received just under half the votes in 2014. This compares to 63% four years earlier. Fourteen of his conservative supporters lost in primaries to more moderate Republicans; others lost to Democrats.
In June 2017, as Congress considered Trump’s tax proposal, the online journal 538 ran an article entitled “the Kansas experiment is bad news for Trump’s tax cuts.” As did Brownback, Treasury Secretary Steven Mnuchin claimed that the GOP tax law would pay for itself through the increased economic activity.Inadvertently confirming the unpopularity of tax cuts for the wealthy, Trump falsely claimed that the act “will protect low-income and middle-income households, not the wealthy and well-connected. … They can call me all they want. It’s not going to help. I’m doing the right thing, and it’s not good for me. Believe me.”
Brookings’ analysis of the Tax Cuts Act of 2017 found that revenue in the year after the act took effect was substantially lower than the revenue the Congressional Budget Office had projected using the previous tax rates.
The U.S. Bureau of Economic Analysis calculates the real gross domestic product every quarter. The graph below shows the percentage change in the GDP for the seven quarters before Trump’s tax law took effect, in blue, and the seven quarters after, in rust. While the quarterly values jump around, on average the law made no measurable difference in the GDP.
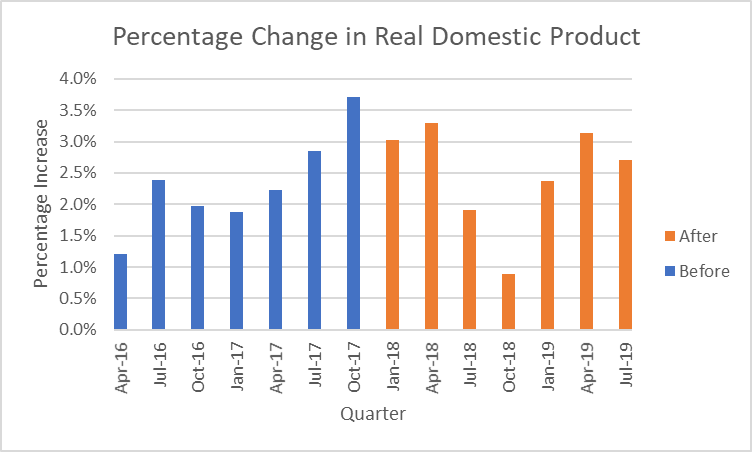
Percentage Change in Real Domestic Product
The notion that the road to prosperity runs through cutting the taxes paid by rich people first appeared early in the Reagan administrations. Despite its repeated failure to produce the results it claims, it lives on. Perhaps part of the reason for its durability is that it appeals to the self-interest of the sort of people on the boards of organizations like the five groups endorsing this proposal.
Data Wonk
-
How Global Climate Change Affects Milwaukee
 Mar 11th, 2026 by Bruce Thompson
-
Will Lawsuits Demanding New Congressional Maps Succeed?
 Mar 4th, 2026 by Bruce Thompson
-
What the 2025 Elections Data Tells Us
 Feb 11th, 2026 by Bruce Thompson